Sunday, August 21, 2016

The Errors You Encounter In Excel Are Telling You Something Important.

If you've used Excel consistently at work for a few months, you will be familiar with some errors Excel displays when it can't get you the answer you want. Oftentimes, we don't give some thoughts to these errors but the truth is they are not random or meaningless, they are trying to tell you something important.

Today, I will be sharing with you how to interpret those errors and uncover the gem in them. How to read the message they are trying to pass across to you.

There are eight error types in Excel:

  1. #VALUE!
  2. #DIV/0!
  3. #N/A
  4. ########
  5. #NAME?
  6. #REF!
  7. #NUM!
  8. #NULL!
#VALUE! Error
You get #VALUE! error when you do a calculation in Excel that doesn't make sense. Like Michael + 2. What is Michael + 2? Is Michael a number? What kind of answer are you expecting? Can you try it on your CASIO calculator? 


To be blunt, #VALUE! is Excel's way of saying someone is stupid. Someone has typed in a calculation that makes absolutely no sense. 

#DIV/0! Error
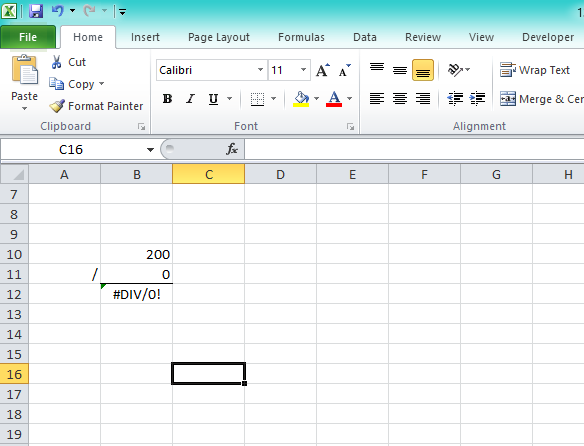
As the name implies, division by zero, #DIV/0! is the error you get when you do any formula that divides a number by zero.


Now, I have a trick question for you: what error do you think Excel will give you when you divide Michael by zero? #VALUE! or #DIV/0!?

#N/A Error
This is the error you get when you do a lookup function (VLOOKUP, LOOKUP, MATCH etc.) and Excel can't find what you are looking for.


####### Error
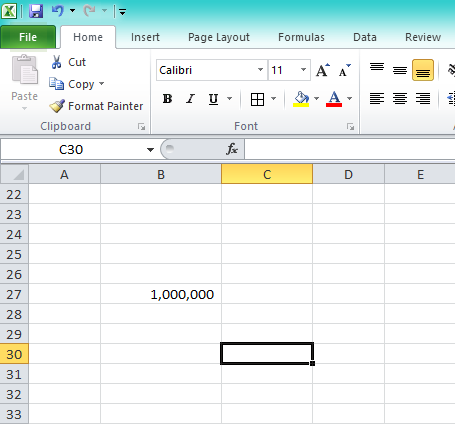
You get this error for two reasons. The first and more common one is when there is not enough space in your Excel cell to display a numeric (number) value. Excel doesn't want you to take 1,000,000 as 1,000 because space was only enough to show 1,000. So it puts in ####### in the entire cell and force you to expand/widen the cell to see the entire content.


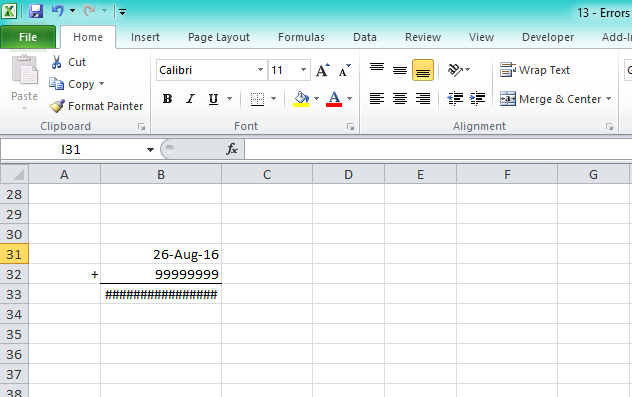
The second and less common one is when you do a calculation on date and the resulting date answer is too large or too small a value to be shown as a valid date in Excel. Here's what I mean. In Excel you can do 26-Aug-16 + 1 and you will get 27-Aug-16 (the next date).

But when you try 26-Aug-16 + 999999999 you get ######## and no amount of expanding the cell will make the error go away. You are trying to calculate a post-apocalyptic date.


#NAME? Error
This is the error you get when you type a formula name that doesn't exist in Excel. Maybe you wanted to type SUM but mistakenly typed SUN. Well, Excel doesn't know about the solar system so t will tell you that it doesn't recognize that formula name.


#REF! Error
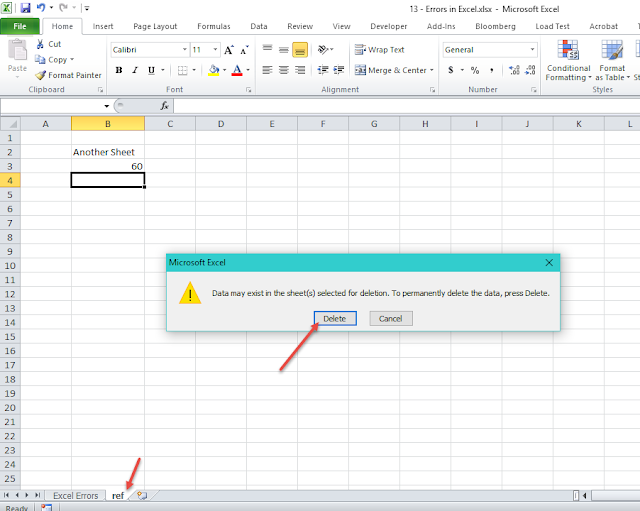
This is a very popular and troublesome error. It happens when you have a formula that picks value from a different sheet or different file and somehow the file or sheet becomes inaccessible (or deleted). When Excel tries to recalculate the formula, it gives you that #REF! error because it can't access one of the reference file/sheet.


Another funny case that causes it is when you drag a formula that depends on a cell above it too way up that it messes with Excel's cell reference system.


#NUM! Error
This is the error you get when you do a calculation that is too large or too small for Excel to handle. An example is 999 raised to the power of 99999


#NULL! Error
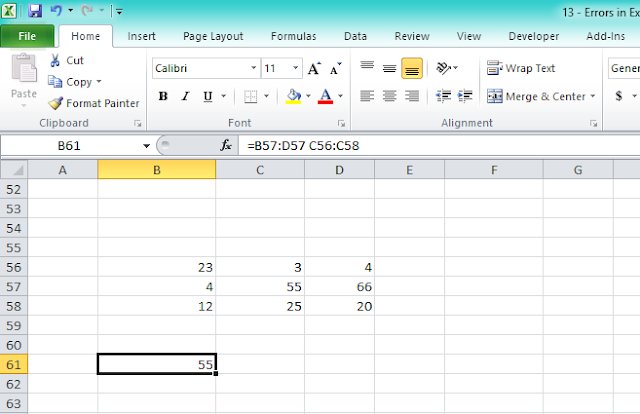
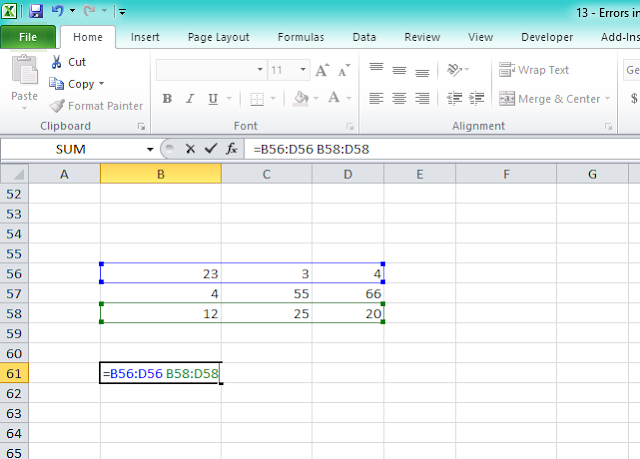
This is a very uncommon error. We are all familiar with the multiplication, addition, subtraction, division etc. operations. There is one not very commonly known -- the intersect operator. And it is simply a space. It gets you the intersect value of two different ranges.


So what happens when you select ranges that do not intersect? You get #NULL! error.


And those are the errors in Excel and their interpretation. Now you know what they are telling you anytime you come across them.

Friday, August 5, 2016

August Webinar: Demystifying Data Analysis, Business Analysis, Business Intelligence and Big Data. No more confusion.

image: kdnuggets.com

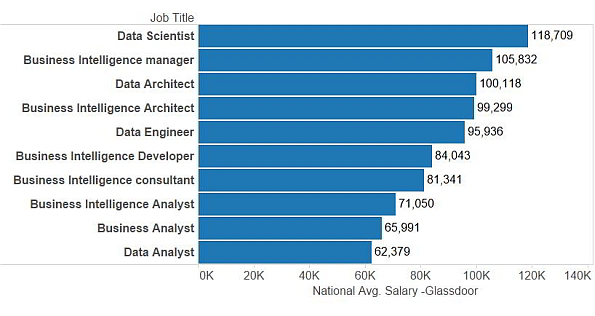
There is too much confusion as to who exactly data analysts vs business analysts vs BI analysts vs big data analysts are.

In this month's webinar, I will be helping you avoid those confusion and hopefully help you find which you really want to develop skills in.

I will be sharing my practical knowledge interacting across the boundaries of them all and the tools used by each.

The date is Thursday 11 August 2016 and time is 4:00pm to 5:00pm.

It will be a hangout webinar like the July one and the hangout webinar link is: https://plus.google.com/events/c9jkmfp6j2oa1vr5bspnrlgpk8c

Just make sure you click on it that day (Thursday at 4:00pm) to be part of the webinar. I will also be answering all your questions. So create it as an event in your phone or gmail or outlook calendar to get timely reminder for the event. 

You shouldn't miss it!

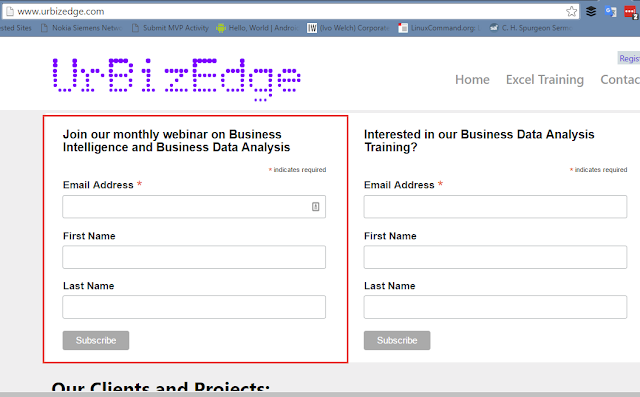
To always be in the loop of future webinar announcements, you can register at www.urbizedge.com (see screenshot below for where to register).


Once you register, you will always be first to be informed about our monthly webinars and sent the recording of previous webinars.

Monday, August 1, 2016

New Chart Types In Excel -- Treemap, Sunburst, Histogram, Box & Whisker, Waterfall and Funnel

If you've felt limited by the charts in Excel or would like to do some of those amazing charts you see online, then you've got to try out the new charts in Excel 2016. And if you are in finance and always had to use a complicated way to create waterfall charts, well, those hard days are now over. Same also for our statistically inclined folks -- you can now create your histogram and Box & Whisker charts easily in Excel.

Today, I will be showing you what those charts look like in Excel. And if you are impressed enough to want try them, all you need is Excel 2016. Better if you have the O365 subscription pack one, I think those ones get pushed new updates first.

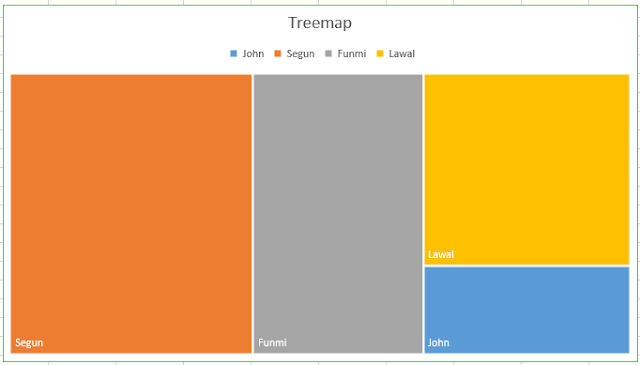
1. Treemap.


This lets you use rectangular bars of varying height and width to visualize performance or values of different entities.

2. Sunburst
It's a lot like Pie chart and Doughnut chart, main difference is that it automatically sorts the data to be visually represented in descending order clockwise.

3. Histogram


It is for showing frequency distribution. Those of us with some statistical background will be at home with it.

4. Box & Whisker


This is also a statistician's tool. It is for showing the spread of values for the different quartiles in the data.

5. Waterfall.


This is an accountant's staple. It shows incremental effect of connected data points.

6. Funnel 

If you are into sales you will be familiar with funnels. How many leads you need to get a sale? Conversion rates? With a funnel chart you can visually depict each level of your sales activities and their conversion rates.

And those are the new chart types in Excel.

You can access them natively from the chart menu.