Wednesday, June 28, 2017

The Attributes You Need To Thrive In The Data Analysis World

image: laptimeclub.com
To successfully begin a data analysis career and thrive in it, you need the following attributes:

1. Lots of tolerance, especially when frustrated
The problem I see with many people who don't go beyond talking about becoming a data analyst is that they don't have much tolerance for slow progress. They want to learn something today and apply it tomorrow; and when they can see how to apply what they are learning, they give up.

When it comes to data analysis, especially if you are coming from a non-numerate field, you will have the initial problem of conceptualization. The big question of how do you know that this is what to do with the data? It is the first reality that hits you once you transition from doing guided practice to tackling a real-world problem.

Then the second problem you face is that the steps needed to battle each data analysis task are always different. So you can read many books, watch many training videos and do many guided practice, you will not escape being stuck on your first non-guided tasks because you will need to do something you've never done before. Rather than complain, just google the way out.

Also, you will have mood issues. There will be times you just won't be in the mood for any non-guided data analysis. The main reason why we consultants tend to know a lot more than in-company staff who might even have been in the field for many years before us, is that we don't do the same type of tasks day in day out. Almost every data analysis project I get requires deep fresh thinking and most clients are very scanty on details (some don't even know what they should want and entirely rely on you to think that out for them).

2. Love for the work
You will have to put in many hours of study, practice and thinking. If you don't love working with data, you will burn out quick. You must be okay with thinking about your data work at night and in your dreams.

3. Willing To Help Other People
Freely, at first. It is only by doing and in various circumstances do you get very good at data analysis. It is by helping others with their data analysis work that you get that valuable hands-on expertise.

4. Continuously Learning
There are no end to tools, algorithms and methods for carrying out data analysis. The person who stops learning new tools and methods will soon find himself no longer relevant. Even if you don't see any compelling reason to ditch your tool for the new ones, still learn them. You don't want to have too many knowledge gaps when that new tool suddenly becomes greatly improved and the new world standard.

And these are the attributes I think anyone wanting to thrive in the data analysis world should have.

Wednesday, June 21, 2017

Scrapping Tweets About Buhari, Osinbajo and Trends: How To Schedule R Scripts To Run Daily Using Windows Task Scheduler

Today (5th June, 2017), I finally got around to doing the R script that will daily mine social media data off Twitter about conversations around President Buhari, Acting President Osinbajo and whatever is trending in Nigeria twittosphere. Will keep it running to do fun or even commercial projects in and beyond 2019 (election year).


The interesting challenge there was to schedule this to run daily, saving the tweets in a CSV file incrementally.

I found two ways online -- the familiar Windows Task Scheduler way and using taskscheduleR

I already use Windows Task Scheduler for a couple of Python scripts and familiar with the setup, so I decided to go along with it.

It is straightforward to use. I have broken the entire process into two steps:

Step 1: Create a Batch file to run the R script
Create an empty text file and save it as .bat file. Then get the executable path of your R installation. Mine is C:\Program Files\Microsoft\MRO-3.3.1\bin\R.exe

Also get the path of your R script. 

Now set up the .bat file like I did mine below

@echo off
"C:\Program Files\Microsoft\MRO-3.3.1\bin\R.exe" CMD BATCH "C:\Users\Michael Olafusi\Documents\TwitterScrapper.R"


Step 2: Create the Scheduler Task
Launch the Task Scheduler (just search for it if you use Windows 10, 8 and 7).


In the Task Scheduler window, at the right pane, click on Create Task.


And follow my screenshot guide below.


And that is it!

And that's how I scheduled the R script to daily mine tweets about Buhari, Osinbajo, Biafra and what's trending in Nigeria.

I intend to do a trend sentimental analysis on them going into the Election days in 2019.

Wednesday, June 14, 2017

How To Select, Delete or Replace All Blank Records In Excel

First, I have got to thank my fellow Excel consultant, Olukunle Babajide, for opening my eyes to this interesting use of Go To Special. Seeing him do it was a lightbulb moment for me and I have used it to solve many issues that my usual method would have taken me many extra steps to fix.

What do you do when you have blank rows in a table of thousands of rows? That is what I usually have when I copy daily stock price or Crude Oil price from the Bloomberg Terminal into Excel, the weekend days come up as blank rows. Or in your case, it could be a malformed table someone sent you and you need to remove those blank rows.

Well, today is your lucky day! I will be sharing with you a neat and quick way to get it done. Below is a snapshot of the table I will be using for illustration and as you can see, it has a few blank rows.


To clean off (delete those rows), I select the entire messed up table and navigate to Find & SelectGo To Special.


In the Go To Special dialog box that pops up, select Blanks.


And you'll see all the Blanks selected. Now you can use Delete Cells or the keyboard shortcut (CTRL + -) to wipe off those rows by indicating Shift cells up.


And voila! It is done.


And rather than deleting those blank records, you can also replace them with any values of your choice all at once, using CTRL + Enter.


Saturday, June 10, 2017

Comprehensive Introduction To Power BI And The Value Proposition

Power BI is Microsoft's self-service Business Intelligence solution and is the most popular self-service BI solution in Nigeria. Many companies in Nigeria are beginning to realise the huge importance of having flexible and robust BI reports and a lot of them are turning to Power BI due to the local presence of Microsoft and the low entry fee of Power BI compared to the other self-service BI solutions.

As a business professional, what do you need to know about Power BI and its potential value to your organization? Well, that is what we are going to discuss in the next few paragraphs.

Before the advent of self-service BI solutions, companies used to have a data warehouse or IT team who manage the company-wide data using Microsoft SQL servers, Oracle database servers and MySQL database servers (there are others but these are the most popular ones). These tech-savvy team model the company data and provide portals for the other teams/departments in the company to download data they need for their reports. Sometimes, they create reports too for the business managers to consume but these reports are often static and not robust enough for day-to-day business needs. Hence, the need for a second group of people -- analysts. They could be sales analysts, operations analysts, customer service analysts, marketing analysts or data analysts. This set of people create the highly important day-to-day reports that management use to keep the business running smoothly and for strategic planning. These reports are mostly made with Microsoft Excel because of its ease of use and managers' preference for it. And again, before now, this was good enough.

However, since the advent of self-service BI, Excel is now no longer good enough for reporting all the business operations. Excel is still extremely important and useful but not great at providing real-time robust dashboards/reports that can be consumed on the go by managers (without having to lug around a laptop and Excel). Managers are increasingly looking for reporting tools that provide them real-time access to their business data reports and accessible from their iPads, tablets and smartphones even in the middle of the night or while on a vacation in a remote island/village. And that is the very thing with many other valuable features that self-service BI solutions like Power BI provide.

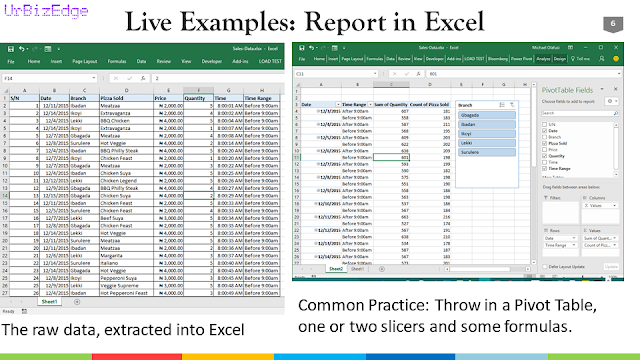
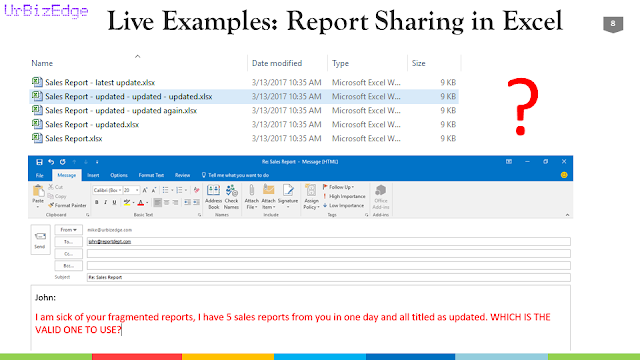
With Excel, you have to create the reports repeatedly and email them out. I used to work as a business analyst and MIS analyst for Comviva on an Airtel Africa CRBT project. I often say I worked for Airtel Africa as Comviva was a sister company to Airtel, both were owned by the Bharti Group. I used to create 11 daily reports -- one for each of the 10 countries we were operating in in Africa and one pan-Africa report to the Airtel HQ in Kenya. Then every Friday, I create a weekly report and presentation. Been very good in Excel, I created a template to automate the reports and reduce my daily repetitive tasks. Yet two things could not be automated away and gave the management concern -- they only get the reports when I email them out and they always have to view it on their laptops. How were these a problem? On Saturday and Sunday, they are blind. They don't see what has happened all throughout the weekend till I send out reports on Monday. Then, whenever they are in a meeting or on a flight, they have to wait till they can open their PC, download the reports and interact with it before they can fully know what's in it.

Now, with Power BI, those problems are no more. I can design the reports once and set it to update automatically each day, so I don't have to daily recreate the reports. Then the managers can view the reports any day, especially on Saturday and Sunday, and see the updated (real-time) analysis. Lastly, they don't have to be on their PC. They can access the reports on their smartphones, tablets and any internet connect device that has a good browser.

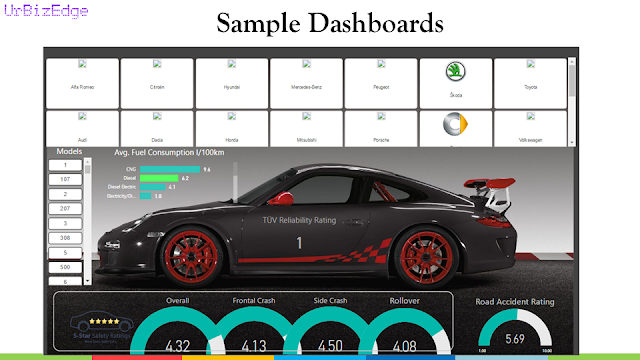
And those aren't just the benefits. You get drill-down capabilities, enhanced visualizations, KPI trigger alerts and many more benefits that managers won't want to turn a blind eye to. Below is the extract of the slides I use to present the benefits of Power BI to managers. You can also view one of my openly available Power BI dashboards that I often use to show the power of Power BI: here and here. Enjoy! 

Note: the sample dashboard slides are extract from publicly available dashboards on Power BI Data Stories Gallery and the quote + architecture slides are from Brandon George's presentation.