Tuesday, November 22, 2016

Data Cleaning Tools In Microsoft Excel

We held a webinar on Data Cleaning in Excel. Well, there was some technical glitches but I think we have managed to find out the root cause and way around the issues to prevent similar glitch in future ones.

You can watch the video of the webinar here, might want to fast forward the glitched part.


As a compensation, I will be taking you through the crux of what I shared in the webinar with plenty easy to follow screenshots.

1. Text to Column
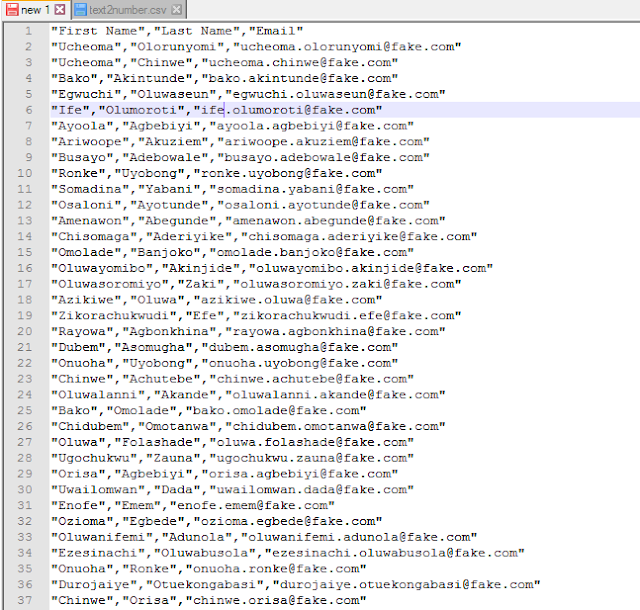
Sometimes, you copy data from other applications into Excel and they don't get arranged the way you want. Maybe you copied customer data records with first name, last name and email and instead of Excel putting them in different columns/fields, you get them sandwiched into one field. How do you easily remedy that?

Well, I am happy to introduce you to Text to Column.


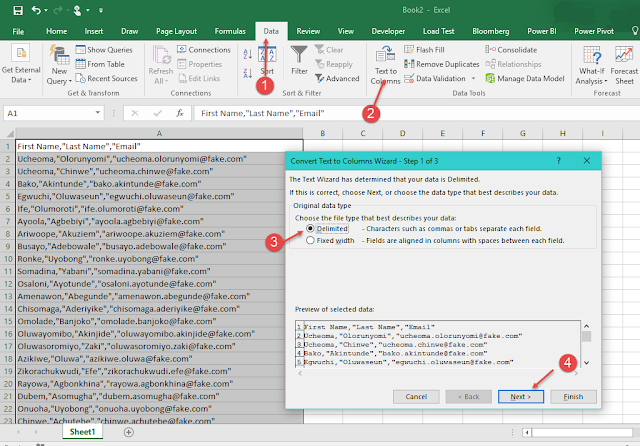
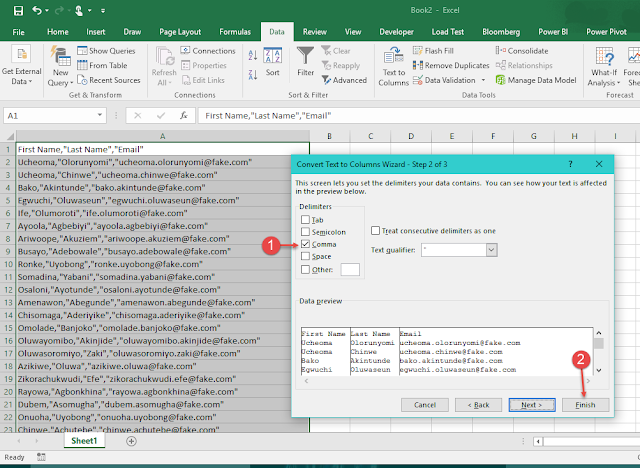
To fix this, go to Data Menu, Text to Column and in a matter of 3, 4 clicks you are done. Even for a hundred thousand records table.


2. TRIM
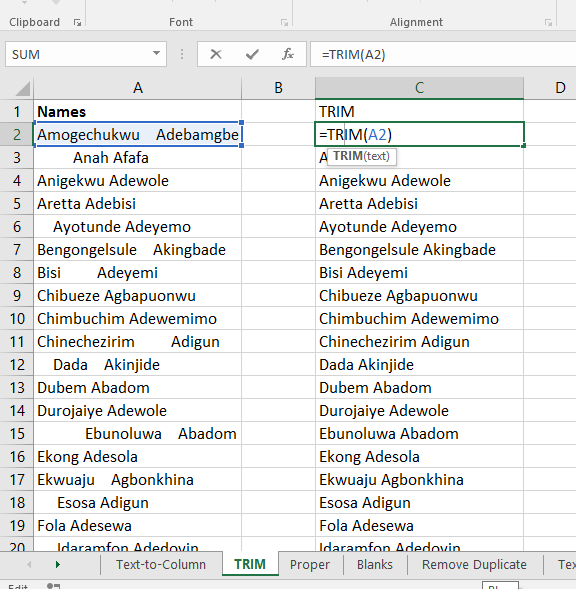
Got text data with the spacing irregularly done? No worries, meet TRIM.

It can turn records that look like this:

Into this pleasant looking one:


3. PROPER and UPPER
Got text or names written with all lower case or terrible mix of the cases? Time to fix them looking Proper or all in UPPER.


4. Go To Special, Blanks
There is something definitely special about Go To Special beyond its name.

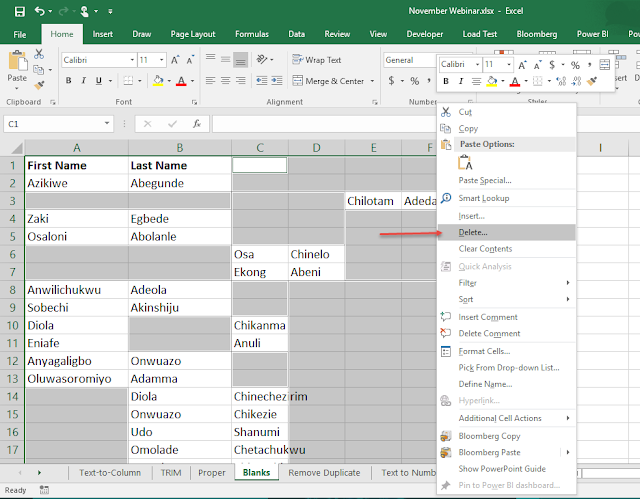
Have you got records arranged disorderly and you want to align the arrangement. Take for example, the one in the screenshot below.


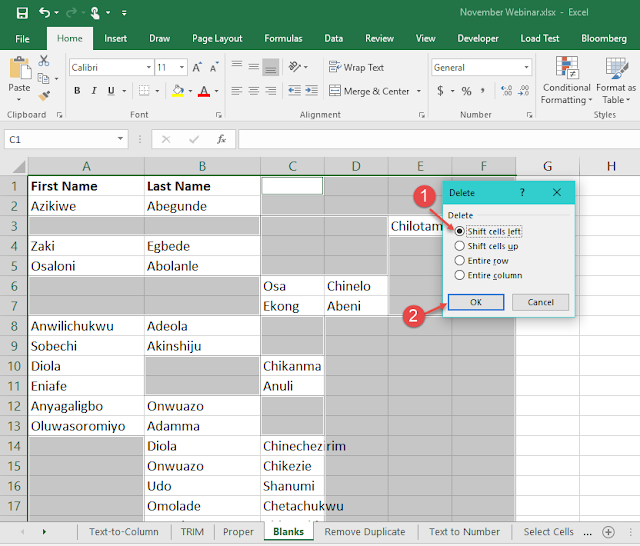
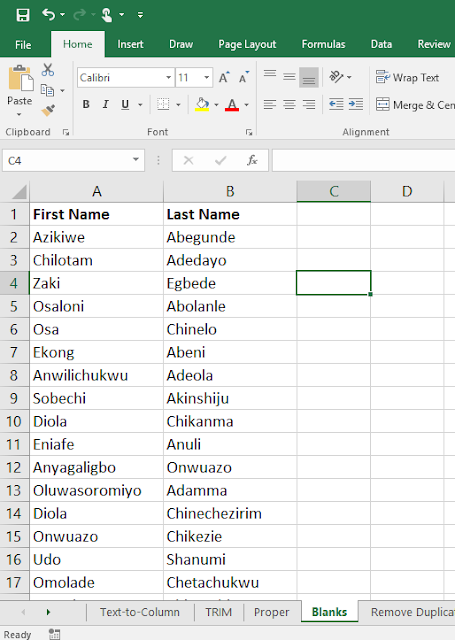
With Go To Special, select Blanks. Then right click on the highlighted Blanks and Delete, shifting cells to the left. And, voila! It is done!


5. Removing Duplicates
Say you have a table with duplicate records. How do you remove the duplicate entries, leaving one unique record?

You guessed right: by using remove duplicates.

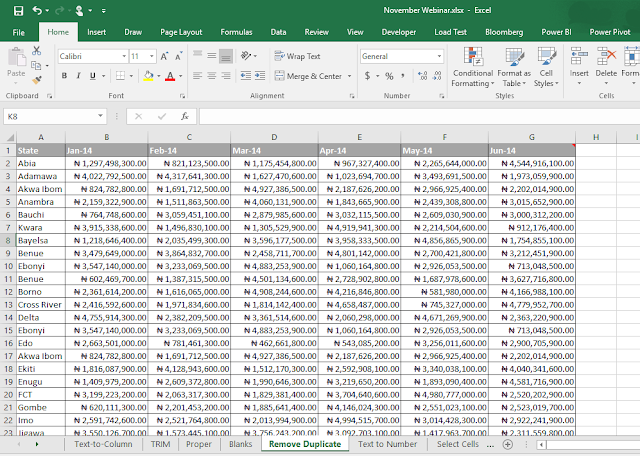
Here is a sample problem to attack.


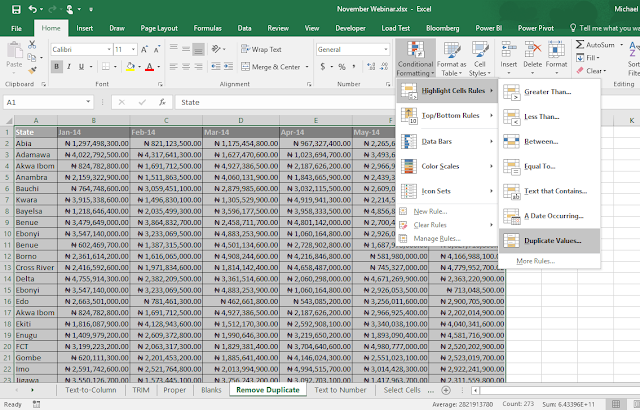
First, we'll make Excel show us the duplicate records using conditional formatting. It's not a requirement. Just doing it for fun or maybe you really want to see the duplicate records before deleting them. 


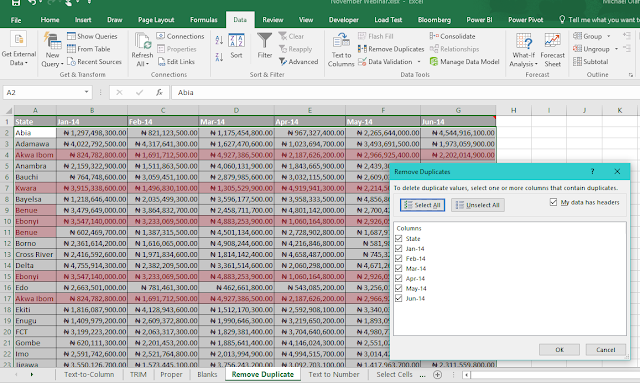
Now let's remove the duplicate values. Go to Data Menu, Remove Duplicates.


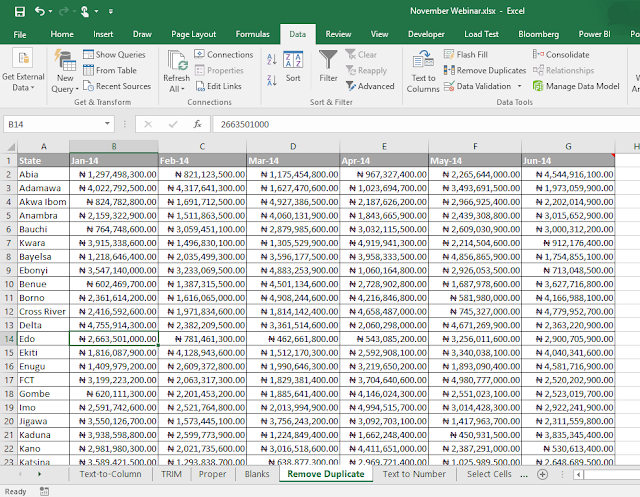
See result below. Sparkling clean. No more greasy duplicates.


6. Text 2 Number
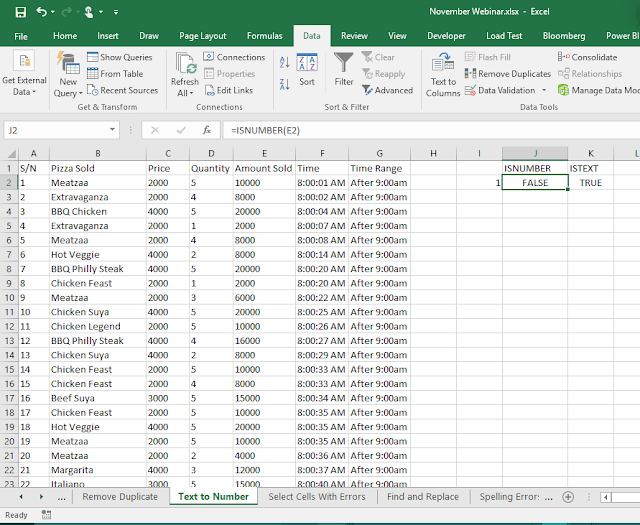
Sometimes, you import or copy numeric data into Excel and they show up as Text. For you to run regular calculations, with peace of mind, on them you need to convert them back to numbers. 

If you are lucky, which is the usual case, Excel will show you a diamond tool tip to guide you in converting the Text numbers to Number numbers😀.

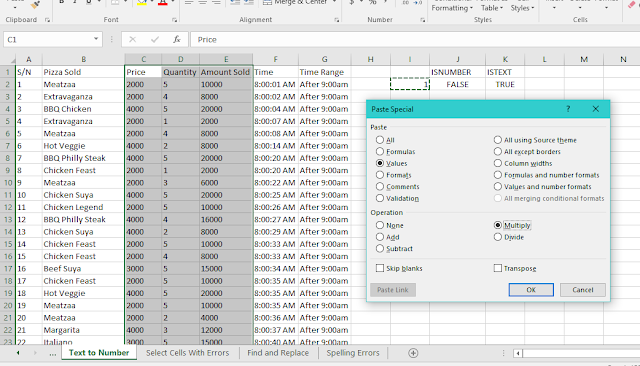
Say today you weren't that lucky. No diamond tool tip. How do you proceed, and considering there are hundreds or thousands of records to fix at once.

Well, use what I call Text 2 Number.

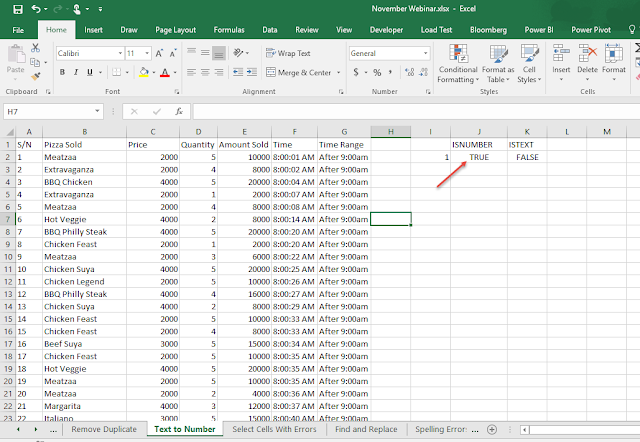
Just type 1 in any empty cell, copy it and paste special on the problematic entries but as Value and Multiply.


That fixes it in one step for you.


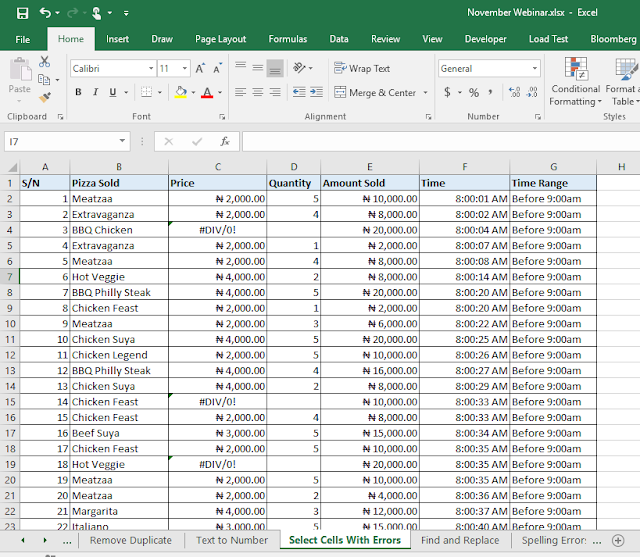
7. Go To Special, Errors
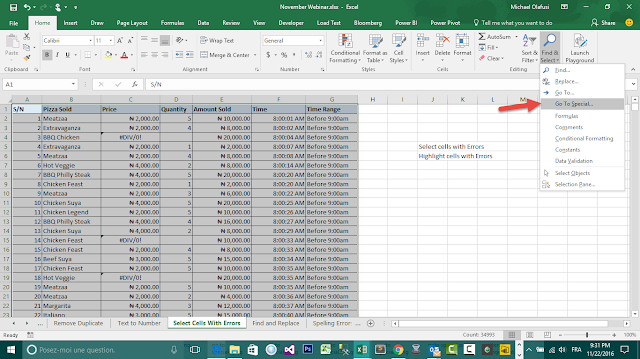
How do you select Error cells in your report and maybe replace them with something more meaningful or delete them all at once?

Again, meet Go To Special.


8. Find and Replace Formula Parts
Find and Replace can work also on formula components. I often use it in making giant templates or in cleaning up my formulas after considerable report structure change.


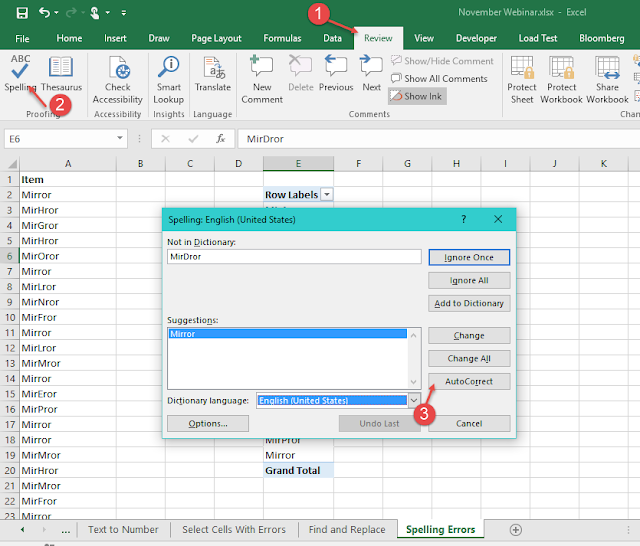
9. Spelling Check and Auto Correct
Surprised? Well, Excel does have spell check and auto correct.


And those are the Data Cleaning tips we treated yesterday during the webinar.

Don't forget to forward this to friends and family members who will find this useful and love you more for it. And you should subscribe to our webinar directory to be in the loop of all future webinar announcements.

Thursday, November 3, 2016

Training: Data Analysis and Business Intelligence Using Power BI

Data is the new crude oil. And business success in the 21st century is heavily reliant on the ability to mine and use relevant data about consumers, internal operations, financial operation and industry trend to drive business decisions.


UrBizEdge Limited, Nigeria’s leading business data analysis company is putting together this special training for proactive business professionals who already have some experience with business reporting and quantitative data analysis.
We will be focusing on Business Intelligence and how to create BI reports that leverage participant’s current data analysis skills using Microsoft’s Power BI. Power BI enables organizations to have a wholesome understanding of what is happening at all operational levels of the company.
This training is coming up on Friday 2nd December 2016 to Saturday 3rd December 2016. It covers our industry recognized certificate, practice materials, required software, tea break + lunch and other training materials.

The training will be facilitated by an officially awarded Microsoft Most Valuable Professional (MVP). And we have had participants of our training from Promasidor, Citi Bank, Dalberg, SaveTheChildren, Mobil, Total, Vodacom, Nestle, Guinness Nigeria, Nigerian Breweries, Delta Afrik, LATC Marine, Broll, Habanera (JTI), SABMiller, IBM, Airtel, Diamond Bank, ECOWAS, Ministry of Finance, Palladium Group, Nokia Siemens Networks and DDB.

To register reach Michael on 08089382423 and mike@urbizedge.com or Hannah on 08021180874 and hannah@urbizedge.com to register. There is a class size limit.
Date: Friday 2nd December 2016 to Saturday 3rd December 2016
Time: 9:00am – 5:00pm each day
Venue: Kristina Jade Learning Center, 70b Olorunlogbon street, Off Alade Lawal street, Anthony Village, Lagos. 
Cost: N100,000/participant

The training will cover: 
1.       Power BI’s strength and weakness compared to the other popular BI tools
2.       Important concepts of Power BI
3.       Connecting to any type of data source (from structured to unstructured which will require some transforming)
4.       Getting data from existing services, organizational content pack, flat files and live databases
5.       Data Transformation (very broad and requires some knowledge of data analysis) and we will use DAX formulas too
6.       Creating relationships between the datasets and leveraging hierarchy (a.k.a. data modelling)
7.       Creating Reports
8.       Visualizations and the science behind choosing the right visuals
9.       Importing custom visuals (especially word cloud for sentiment analysis and other very useful non-native visuals)
10.   Creating dashboards
11.   Publishing Reports from the Power BI Desktop and pinning to dashboards
12.   Scheduling refresh
13.   Q & A Natural Language query
14.   Integrating with Cortana
15.   Live Dashboards
16.   Collaboration and sharing
17.   Printing the dashboard
18.   Analyzing the dashboard data (report) from Power BI service in Excel (new feature)
19.   Value Proposition to corporate customers
20.   Use case scenarios for entire company or business unit or departments
21.   Access from mobile app and setting data alerts (automated notifications when something of note happens)
22.   Lots of interaction (Q&A) and practice

 
Reach Michael on 08089382423 and mike@urbizedge.com or Hannah on 08021180874 and hannah@urbizedge.com to register. There is a class size limit.


You can also sign up for our highly educative tutorial newsletters at http://blog.urbizedge.com/ and read/download our Data Analysis Industry Report for 2016 for your company use.

Tuesday, November 1, 2016

Whitepaper: Data Analysis Industry Report 2016 - Nigeria

We are finally done with the whitepaper on the Data Analysis Industry in Nigeria for 2016.

You can download it here: Data Analysis Industry Report 2016 - Nigeria


Data Analysis Industry Report 2016 - Nigeria from Michael Olafusi

If you know someone who might benefit from the report, please do forward/share.

Also send me us your feedback or what you'll like covered in the 2017 edition.

Wednesday, October 12, 2016

October 2016 Webinar: Dashboards And Dynamic Charts In Excel

This October's monthly webinar will be for Wednesday, 26 October 2016. I will be walking us through the concepts of Dashboard and building dynamic charts in Excel.


Dashboards are clear visuals of the insights in your reports in a consolidated and easy to understand way. Just think about your car's dashboard. In one glance you get to see the state of your car. And that is the way your visuals should be like if you are making reports on a system as complex as a car, having many intricate moving parts and lots of KPIs to track.

Maybe you are a sales analyst and you track over a dozen brands/products across dozens of regions/areas. Your final report is a labyrinth, even you sometimes get lost in it.

Maybe you make a fairly simple report but the lines of records are many and regular charts look so crowded/clumsy that you have given up including charts in the report.

Or maybe you want to make more engaging visuals, put in some element of interactivity. Make the data come alive. 

Then you shouldn't miss this webinar.
Date: Wednesday 26 October 2016
Time: 4:00pm UTC+1 
Venuehttps://www.youtube.com/watch?v=MfnSWzwU5JY (YouTube live)

We run webinars monthly on how to improve your business data analysis skills. To be among the first informed monthly about the webinars and get timely reminders, please sign up here: Webinar Directory.

Sunday, August 21, 2016

The Errors You Encounter In Excel Are Telling You Something Important.

If you've used Excel consistently at work for a few months, you will be familiar with some errors Excel displays when it can't get you the answer you want. Oftentimes, we don't give some thoughts to these errors but the truth is they are not random or meaningless, they are trying to tell you something important.

Today, I will be sharing with you how to interpret those errors and uncover the gem in them. How to read the message they are trying to pass across to you.

There are eight error types in Excel:

  1. #VALUE!
  2. #DIV/0!
  3. #N/A
  4. ########
  5. #NAME?
  6. #REF!
  7. #NUM!
  8. #NULL!
#VALUE! Error
You get #VALUE! error when you do a calculation in Excel that doesn't make sense. Like Michael + 2. What is Michael + 2? Is Michael a number? What kind of answer are you expecting? Can you try it on your CASIO calculator? 


To be blunt, #VALUE! is Excel's way of saying someone is stupid. Someone has typed in a calculation that makes absolutely no sense. 

#DIV/0! Error
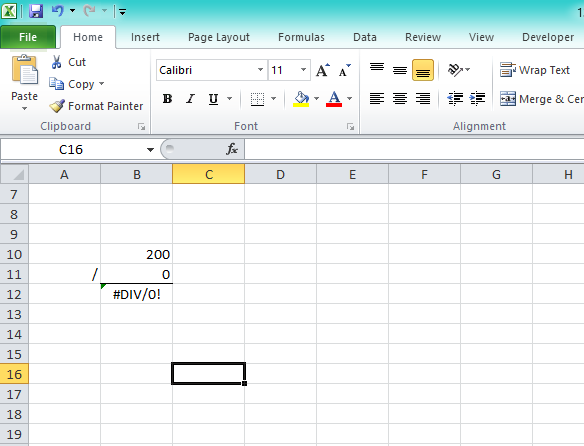
As the name implies, division by zero, #DIV/0! is the error you get when you do any formula that divides a number by zero.


Now, I have a trick question for you: what error do you think Excel will give you when you divide Michael by zero? #VALUE! or #DIV/0!?

#N/A Error
This is the error you get when you do a lookup function (VLOOKUP, LOOKUP, MATCH etc.) and Excel can't find what you are looking for.


####### Error
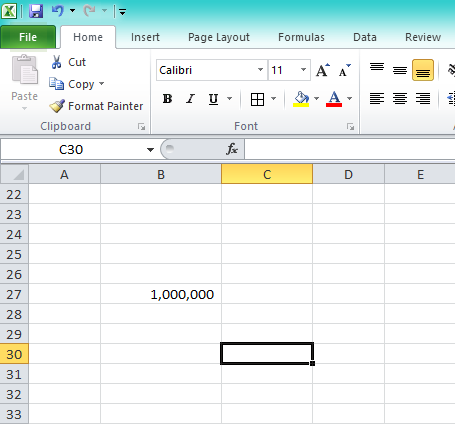
You get this error for two reasons. The first and more common one is when there is not enough space in your Excel cell to display a numeric (number) value. Excel doesn't want you to take 1,000,000 as 1,000 because space was only enough to show 1,000. So it puts in ####### in the entire cell and force you to expand/widen the cell to see the entire content.


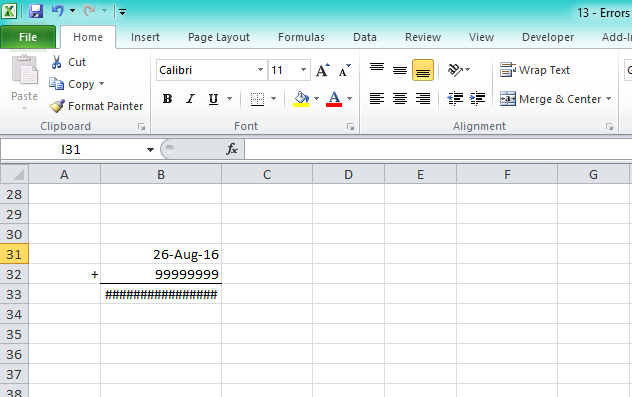
The second and less common one is when you do a calculation on date and the resulting date answer is too large or too small a value to be shown as a valid date in Excel. Here's what I mean. In Excel you can do 26-Aug-16 + 1 and you will get 27-Aug-16 (the next date).

But when you try 26-Aug-16 + 999999999 you get ######## and no amount of expanding the cell will make the error go away. You are trying to calculate a post-apocalyptic date.


#NAME? Error
This is the error you get when you type a formula name that doesn't exist in Excel. Maybe you wanted to type SUM but mistakenly typed SUN. Well, Excel doesn't know about the solar system so t will tell you that it doesn't recognize that formula name.


#REF! Error
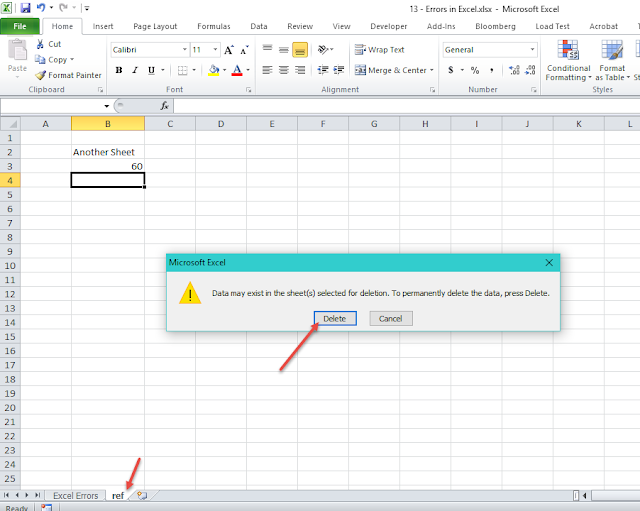
This is a very popular and troublesome error. It happens when you have a formula that picks value from a different sheet or different file and somehow the file or sheet becomes inaccessible (or deleted). When Excel tries to recalculate the formula, it gives you that #REF! error because it can't access one of the reference file/sheet.


Another funny case that causes it is when you drag a formula that depends on a cell above it too way up that it messes with Excel's cell reference system.


#NUM! Error
This is the error you get when you do a calculation that is too large or too small for Excel to handle. An example is 999 raised to the power of 99999


#NULL! Error
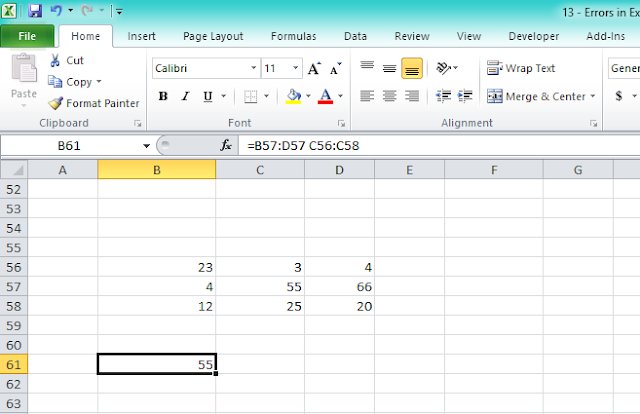
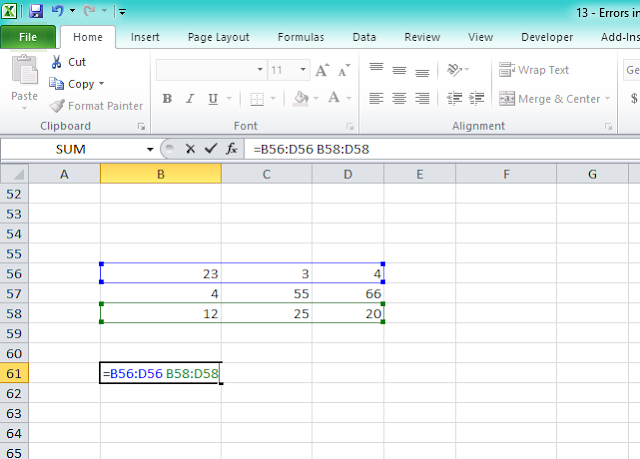
This is a very uncommon error. We are all familiar with the multiplication, addition, subtraction, division etc. operations. There is one not very commonly known -- the intersect operator. And it is simply a space. It gets you the intersect value of two different ranges.


So what happens when you select ranges that do not intersect? You get #NULL! error.


And those are the errors in Excel and their interpretation. Now you know what they are telling you anytime you come across them.