Wednesday, January 25, 2017

The Seven New Charts Exclusive To Excel 2016

In August 2016 we wrote about the new chart types in Excel 2016

Since then, the list has grown slightly. Now we have seven new chart types in Excel 2016. 

The latest entry is Filled Maps. It allows you do a map of your location/state/branch/region/city/country data with a graduated fill to show the values (of any metric) across those locations.


The other ones are:
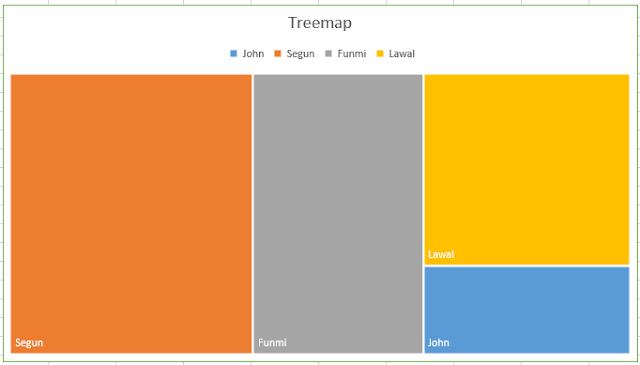
 Treemap

Sunburst

Histogram

Box and Whisker

Waterfall


Funnel

For extra commentary on the charts other than the filled map, you should read: http://blog.urbizedge.com/2016/08/new-chart-types-in-excel-treemap.html

Wednesday, January 18, 2017

The Recorded Version of Our December Webinar On PowerPivot

On Tuesday we did have the webinar on PowerPivot. For one hour I showed how to combine data from difference sources and easier transform them into ones you can use to create meaningful single page dashboards.

I covered using the Query Editor in Get & Transform panel in Excel. We pulled in over 15 report tables from Excel and one database table from SQL, and combined them to create a dashboard that ties everything neatly together.

You should watch the webinar here: Turbo Charging Your Reports with PowerPivot


For the demo, I worked on real data of the companies listed on the Nigerian Stock Exchange. And we created a dashboard that looked like the one below.


Don't forget to watch the webinar recording here: Turbo Charging Your Reports with PowerPivot

Wednesday, January 11, 2017

Interested In Learning The New Office.js Excel Add-in?

For some months now I have been digging deep into the exciting new world of Excel (Office.js based) add-in. What does that mean? In straightforward terms, it means the new powerful and exciting way of creating Excel add-ins.


However it has not been easy finding learning resources. In fact, most of the early push and learning I got where based on insider NDA content shared in the Microsoft MVP community. But not everyone will get that silver spoon feeding privilege.

So how would you, without direct content from Microsoft, access resources that will get you started on learning and building your own Excel web Add-ins?

That is the question I have set to provide answer to in today's post.

1. I will recommend you start with Michael Zlatkovsky's Building Office Add-ins using Office.js site


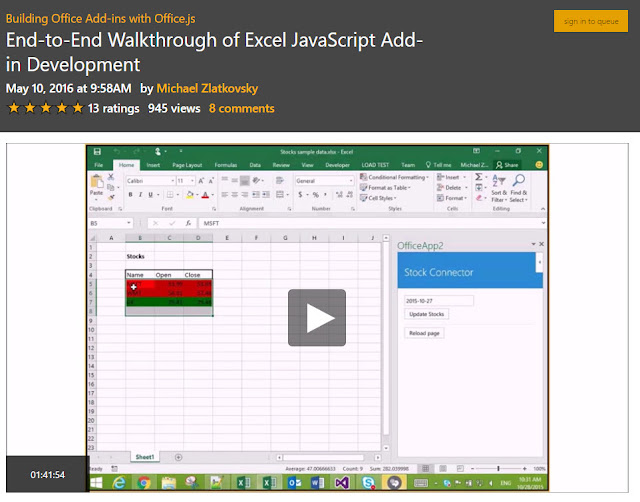
2. I will recommend you watch Michael Zlatkovsky's End-to-End Walkthrough of Excel JavaScript Add-in Development video on Microsoft's channel 9


Also make sure you download the solution file so you can practice along.

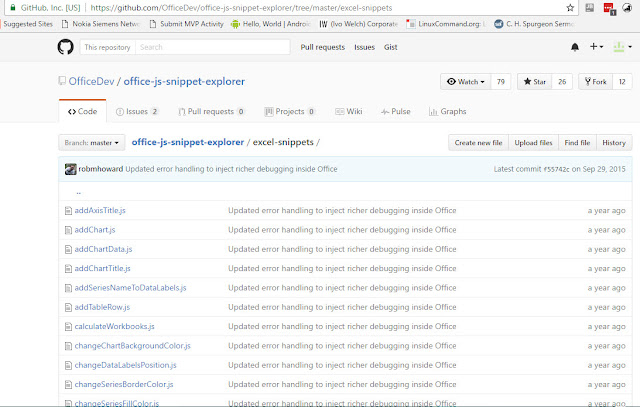
3. Get familiar with the code snippets for doing the common tasks you'll want to carry out at office-js-snippet-explorer/excel-snippets and Office 2016 JavaScript API Snippet Explorer 


4. Build some sample add-ins from scratch with guidance. Try out Build your first Excel add-in and samples with the codes from Office Dev Center.


5. Read more helpful documentation (Excel JavaScript API programming overview and Excel JavaScript API reference) and maybe buy the Building Office Add-ins using Office.js book.


So those are my goto resources. But ultimately, how far you go will depend on how much practice and non-guided add-ins you build.

Best of luck to both of us on this new exciting journey!