Sunday, December 31, 2017

New Year Gift: Get My Power BI For The Busy Professional Book For Free


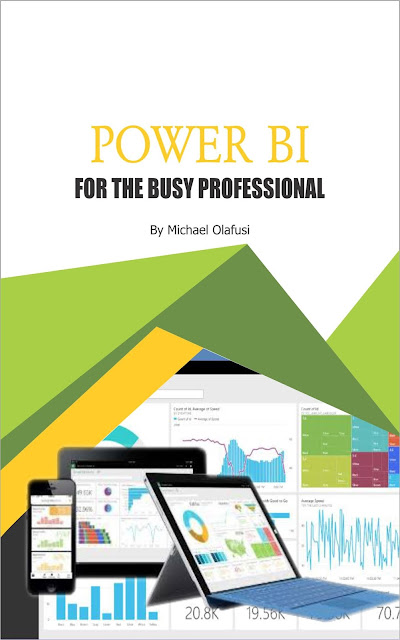
As we go into the new year, 2018, I want to share with you for free my latest book: Power BI for the Busy Professional.

To let you have a glimpse of the value in it, below is the preface:


I started my data analysis career with Comviva – Airtel Africa creating daily, weekly, monthly and ad-hoc reports for the entire operations in the CRBT product unit across Africa. The company operated across ten countries in Africa then and I was creating between 11 and 30 reports daily. The company had just moved to Africa after Bharti Airtel acquired Zain Africa operations, so everything started from scratch – my colleagues and I had to build everything from scratch.

Power BI is the tool I wish we had then. I would have been able to automate all our reports with ability to drill down and drill through, allowed each country operations manager see only what is within their region/country while the big bosses overseeing the entire continent can see everything. I would not have needed to work on public holidays that were local to us since the other country guys needed their reports and were not on holidays.

Most importantly, I would have been able to build more insightful reports and ones focused on providing business intelligence, I would have had more time to do more strategic revenue improving activities rather than slaving away at recurrent reports making. And the management would always have all the data and reports they needed in a very interactive and real-time way.

This book is to give you what I lacked then; it is my own way of making it easy for you to learn and immediately start using Power BI without having to take a leave off work or risk migraines. I have used very easy to follow illustrations with a hands-on approach to ensure that it would be fun and easy for you. You are already a busy professional, this book is to fit perfectly into your life and not disrupt it.

And about me? I am a four-time Microsoft Most Valuable Professional (MVP) and the only one in my area of award in Africa. Helping people and companies make the most of their data is what I do full-time. I have also written books and created online courses that have been used by over 18,000 people across the world. You can connect with me on LinkedIn: https://www.linkedin.com/in/olafusimichael/


You can download the book from Amazon Kindle today for free at https://www.amazon.com/dp/B078NF5XYP or get the PDF version at https://drive.google.com/file/d/1Mj_LRdhZJhoX5A6AxpT3wNDWtKqKB86c/view?usp=sharing 


Enjoy! And a wonderful 2018 to you!

Saturday, December 9, 2017

Power BI #3: The Query Editor

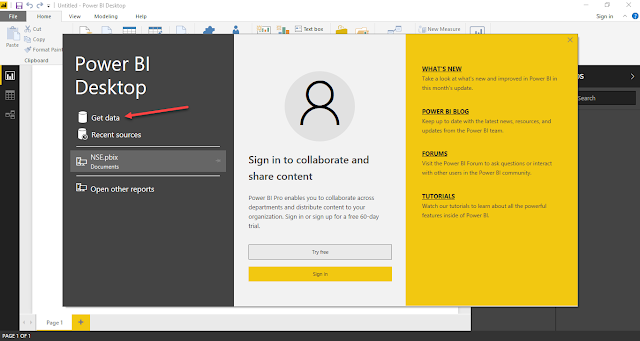
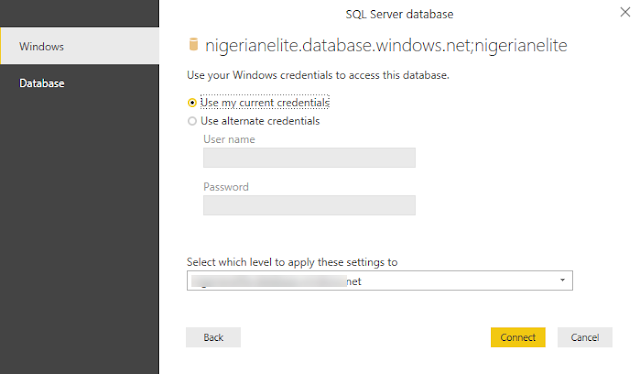
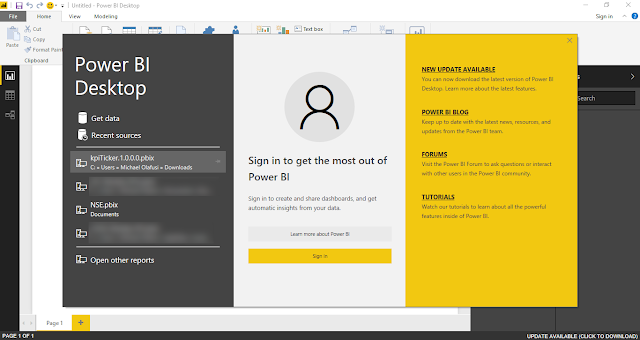
When you launch the Power BI Desktop, the start up screen you get has Get Data on the top left side.


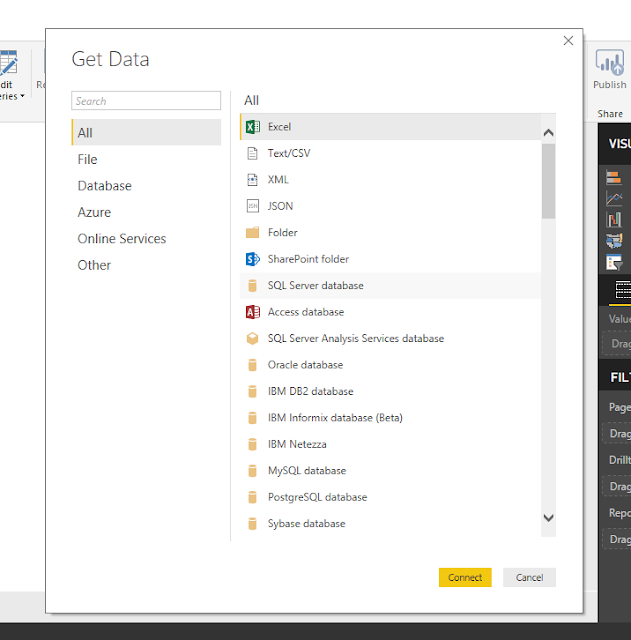
The Get Data is the your first window into the Query Editor. If you are familiar with Excel, the Query Editor is the exact replica of PowerQuery. 


In Power BI, it is your main data manipulation and data cleaning tool. Once you connect to the data you want to analyse, it is good to go to the Query Editor to examine the data and, if the data needs some cleaning or transformation, do all that transformation in the Query Editor.


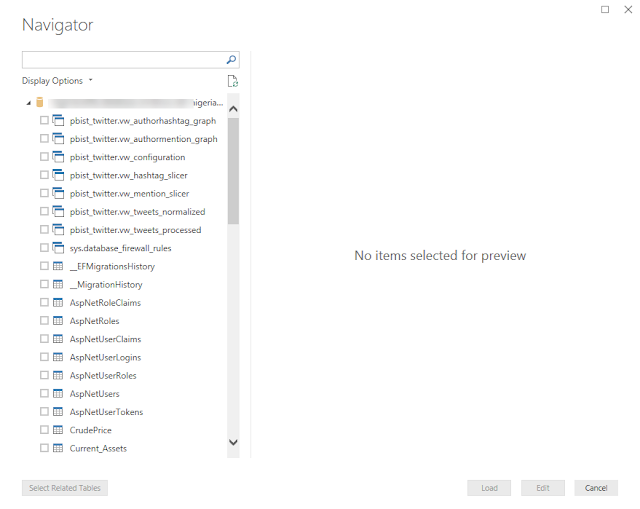
Clicking on Edit, when done connecting to the data, takes you to the Query Editor, and I recommend you always use Edit rather than Load which brings in the entire data without allowing for preview and modification/transformation.

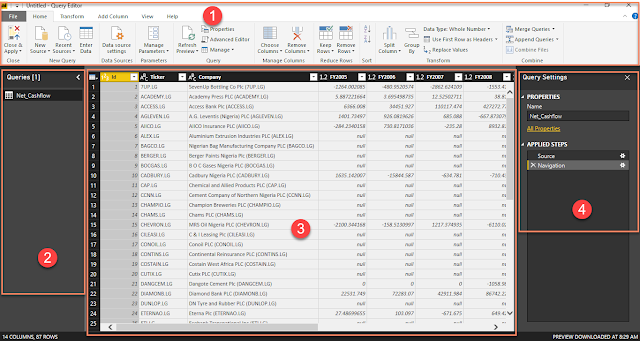
Below is what the Query Editor looks like and it always opens as a separate window from the main Power BI window.


The Query Editor can be divided into four functional sections.


1. Menu section
2. Queries section
3. Data Preview section, and
4. Query Settings section.

The Menu section is more like the control panel housing all the tools you will need for most of your data cleaning and data transformation processes. In the end, it is a section you will have to be very proficient at and we will do a lot of practical demonstration of real world analysis that involves using this section.

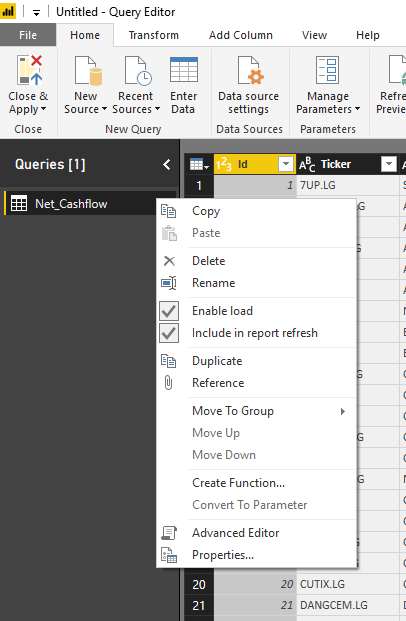
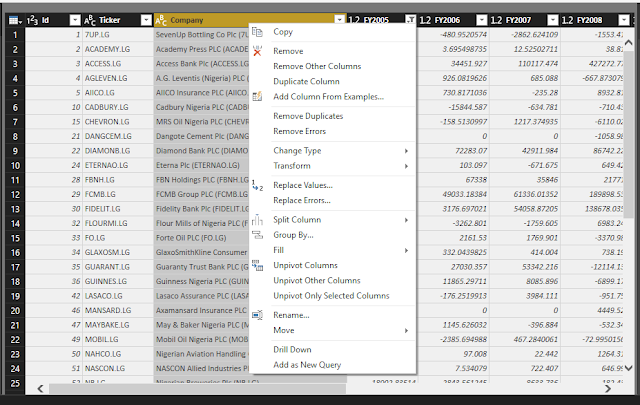
The Queries section mainly lists all the data sources you are connected to. Right-clicking on any of the data source gives you some very useful set of options.


The Data Preview section shows a preview of the data selected in the Queries section. This gives the Query Editor some advantages over loading the data directly into the Data model, especially in a case of a large data set that would take too many system resources and time to load. By loading just a preview, one can get working immediately on the data and even set filters and formulas to pull in just the segment of the data set that is needed rather than pulling in the entire data set. It also has some useful features — like filter, rename, delete, replace errors and others.


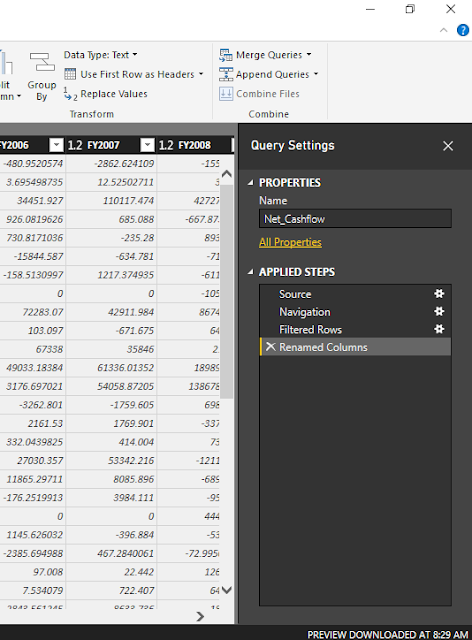
The Query Settings serves as a very interactive and feature-rich audit trail. It allows you to see all the transformation steps carried out in applied order. You can modify any step and re-order the steps if you want.


In future chapters we will do some real world analysis that will help us further dive into the Query Editor and see its practical usefulness.

Wednesday, November 29, 2017

Understanding The Practical Differences Between Excel 2011 for Mac, Excel 2016 for Mac and Excel for Windows

In our training classes, whenever I hear a participant say he can't find a particular menu item exactly where I pointed out then I suspect he is using Mac. And I am usually correct.


If you use the Mac version of Microsoft office, a lot of things are not the same as with the Windows version. In today's post I am going to show you the practical differences you should be aware of between the two common editions of the Mac version and the Windows version of Excel.

First of all, the verdict. My recommendations. 
  1. If you want to be a superb user of Excel for data analysis and master the new advanced tools in Excel, you will have to put aside the Mac versions of Excel. Either you get a Windows PC/laptop or create a Windows OS powered Virtual Machine on your Mac and install Excel on it. 
  2. If you already use Excel on Mac and are okay with not being able to do PowerQuery/PowerPivot, then go for Excel 2016 Mac edition. It is better designed and has more features than the Excel 2011 Mac edition (the edition before the 2016 one as Mac has no Excel 2013 edition). Microsoft has re-added the missing Macro/VBA features people complained about when migrating from Excel 2011 Mac to Excel 2016 Mac, so no reason to stay with the Excel 2011 anymore.

Excel 2011 for Mac


When Microsoft did Excel 2010 for Windows, they also made Excel 2011 for Mac. Unfortunately, their capabilities are not equal. Microsoft tried to give them both the same base features but when you want to do more, like work with Macros/VBA, enable add-ins like Analysis Toolpak or Solver, work with external data sources or do more with your PivotTable then you'll see that the Mac version is somewhat limited compared to the Windows one.

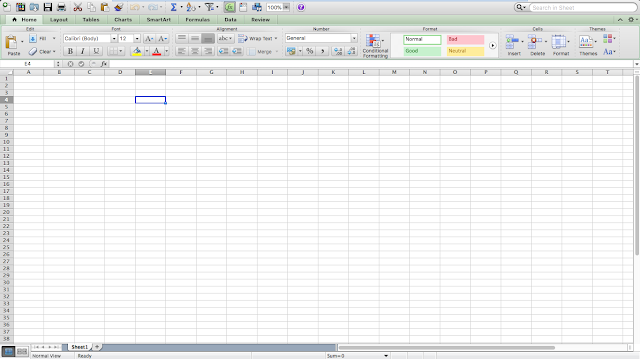
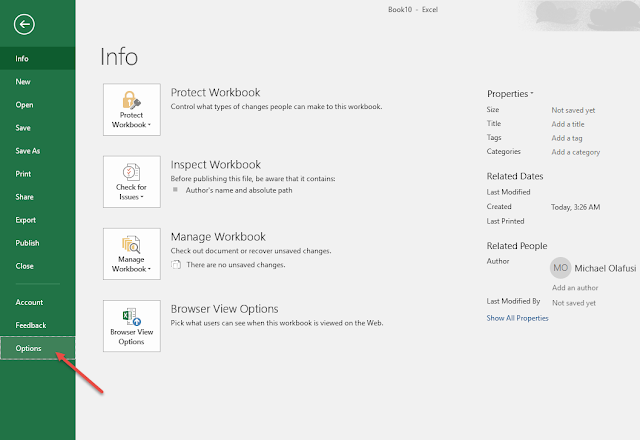
One main thing to note if you are already familiar with the Windows version of Excel is that the File>>Options menu is Excel>>Preferences in the Mac versions.


And if you want to enable the Developer menu, you'll click on Ribbon (last item in the last row) in Excel Preferences window.


Lastly, the menu on the Excel 2011 for Mac can be very confusing. They are two menu layers that you'll find yourself cycling between to locate commands/features you want to use. And it is much worse if you are already used to where things are placed in the Windows version.


Excel 2016 for Mac


Microsoft must have heard the complaints about the Excel 2011 for mac and how much people wanted similar experience and UI to the Windows version. They really did well with the Excel 2016 for Mac one. The menu items are arranged in the same way as in the Windows version. There is still the two menu layers confusion but less confusing than in the Excel 2011. The look is also very cool and mirrors the Windows one.

The main issues are still the advanced tools. And now, with the advent of PowerQuery, PowerPivot, PowerView and many more advanced features in the Excel 2016 for Windows (Office 365 one, especially), the Mac version is looking a lot more like a watered down version. 

Also, just like the Excel 2011 for Mac, the File>>Options menu is accessible as Excel>>Preferences in the Excel 2016 for Mac version.


And those are the practical differences I find between the Mac versions and the Windows version. 

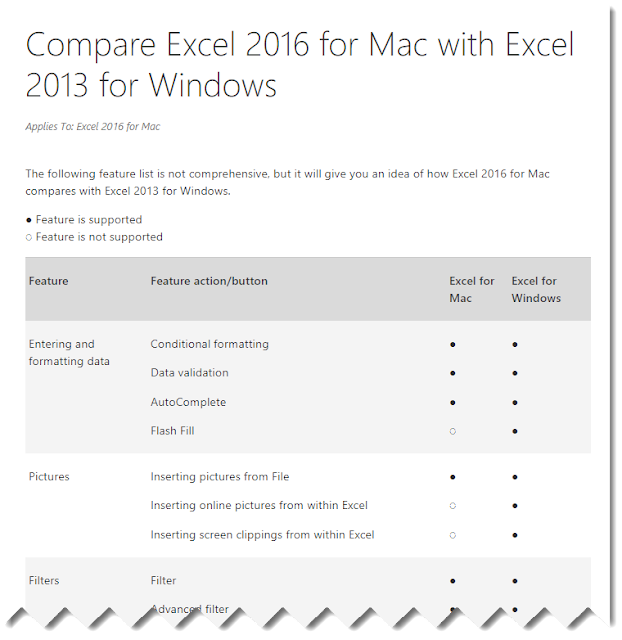
If you would like to read something more official from Microsoft, then head over to https://support.office.com/en-us/article/Compare-Excel-for-Mac-2011-with-Excel-2016-for-Mac-602a6c30-e6a6-47c5-9e0d-b16af397427a (for the comparison between the 2011 and 2016 editions of the Mac versions) and https://support.office.com/en-us/article/Compare-Excel-2016-for-Mac-with-Excel-2013-for-Windows-1b24f293-739c-4120-b884-893b6687e0d0 (for the comparison between Mac and Windows version of Excel).


What are your thoughts?

Wednesday, November 15, 2017

Recorded Video of the Webinar On What-If-Analysis (Goal Seek, Scenario Manager, Data Table) and Solver in Excel


If you missed the live broadcast of the webinar, below is the link to the YouTube recording: https://www.youtube.com/watch?v=eE1yV9RNIko


We covered the following:
  1. How to use Goal Seek to plan towards achieving a specific target/goal. I used four different examples to demonstrate the power of Goal Seek, from business loan planning to product break-even quantity analysis.
  2. How to handle different scenarios and plan more proactively using Scenario Manager. I gave an illustration of how the Nigerian budget office creates scenarios around the crude oil price. The benchmark price they publish in the annual budget that is approved is just one of the many possible average prices of crude oil that they have run the budget through. It helps them put in place the processes and plans that might be drawn on if prices go too far off the benchmark value. Then I demoed how I use it for training planning, to measure the profitability of any training class based on best case, likely case and worst case scenarios.
  3. How to use Data Table to plan more flexibly. It allows you to monitor the results for multiple combinations of changes in two input variables/parameters. I demoed how it would help with determining the profitable price and number of participants combination for a training class idea.
  4. Finally, I showed us how to enable and use Solver for optimization analysis in business. Maybe you want to make the most of your shift workers or run your factory machines more productively or maximize profit margin or minimize costs, once you can outline your business in numbers in Excel linking the inputs to outputs, Solver will do the rest. I demoed how an FMCG uses it to determine how to supply its distributors from their warehouses in such a way that they minimize the freight cost.
You should watch the recorded session: https://www.youtube.com/watch?v=eE1yV9RNIko 

Tuesday, November 7, 2017

The Excel Formulas That Help You With Your Personal Finance and Investment Plans

In september, we had a webinar on Using Microsoft Excel for Investment Planning, Personal Finance & Financial Analysis. Many people loved it and the practical application in their own personal finance and family finances/investment planning. You can still watch the recorded video on YouTube.

Today, however, I have decided to do the written version of it so many more people can benefit from it. You can download the practice along Excel file here.


There are five major formulas you need to have a good grasp of if you want to put some structure and calculations around your financial goals and investment strategy. And they are:

  1. PMT
  2. PV
  3. FV
  4. RATE, and
  5. NPER
PMT
PMT is the Excel formula you use to determine how much you need to save regularly (weekly, monthly, yearly) in an interest bearing account to achieve a particular set financial goal (education fund for your children, buy a house, buy a car or be a multi-millionaire). It is also the formula you use to calculate how much you pay back monthly or yearly for a loan that requires you to pay back the same amount (to cover both interest and principal) over the lifetime of the loan.

How it works is very easy. And below are the transcripts of the demonstration in the video and practice file.

a. Want to have N20 million saved in an education fund for your children by 2030 (13 years time).
Question: How much should you contribute in a 15% annual interest bearing savings/investment account?


PMT has five parameters:
  • Rate: The interest rate. And in this sample case, it is the 15% annual interest rate.
  • Nper: The number of periods. In this case, it is the number of years you plan to save for, 13 years.
  • Pv: Present Value. How much you currently have saved in the investment account. In this case, since we are starting from scratch, that would be zero.
  • Fv: Future Value. The final amount you want in the investment account by the end of the specified period. In this case, 20 million Naira. Notice the minus I put in the formula, it's just a technical way of getting Excel to show the answer in a positive value. That's all.
  • Type: Will you be saving at the end of the year or at the start of the year. For end of year, you put 0 or leave it empty, and for at the start of the year, you put 1. The logic applies for other types of period -- weekly, monthly etc.
One very important thing to note is that the rate and number of periods must agree. You can't use annual rate to calculate monthly contributions without first converting that annual rate to monthly rate. You should check out the part in the practice file on monthly contribution for the same goal to get a good grasp of how to convert from annual rate and annual period to monthly rate and monthly period.

b. You bought a 3 bedroom flat for N100 million and were allowed to do 25% down payment while flexible spreading the remainder in a monthly repayment at a 2% monthly rate.
Question: How much will you pay if you spread the payment over 5 years (60 months)?


Try figure this one out and compare your answer with mine. 

In this sample case, PV is the loan amount outstanding. NPER is the duration. Rate is the repayment interest rate. FV is zero since you mustn't owe them anymore at the end of the duration nor pay them excess. And TYPE is at month end repayment (hence, the leaving empty).

PV
PV is for calculating the worth of an investment project after factoring the cost of the capital (loan interest rate, if you borrowed the money from the bank). 

c. You are part of board of directors for a manufacturing company. They are considering a business idea that will cost N300 million and generate N50 million every year into the 9th year.
Question: If the company's cost of capital (discount rate) is 15% what will be the present value of the business idea if executed and is it a profitable one?


Notice how there is all those components of PMT formula in there -- Rate, Nper, Fv and Type. They still mean the same as previously explained. This time, though, we have the periodic inflow/payment from the business project (same as PMT) and want to calculate the present value/worth (PV). If we can be able to service the cost of the capital deployed and still turn a profit (pay back both the interest and capital of the borrowed money to finance the business idea, and still have something left as profit/compensation for all our stress).

Again the minus in the PMT box is to get Excel to display the final answer in a positive figure. Nothing more.

FV
FV is a very interesting and useful financial planning formula. It allows you estimate how much you will have in an interest bearing account if you do consistent periodic (weekly, monthly or yearly) contribution/saving. 

d. You invest/save N40,000 monthly in a 15% interest rate investment account. 
       Question: In 10 years, how much will you have? What about in 30 years?

I don't think I need to explain how this work, based on all my previously explanations you should be able to figure out how it works.

Also notice how the future value stratospherically increase when you save for 30 years as against the 10 years? That is the power of compound interest.

RATE
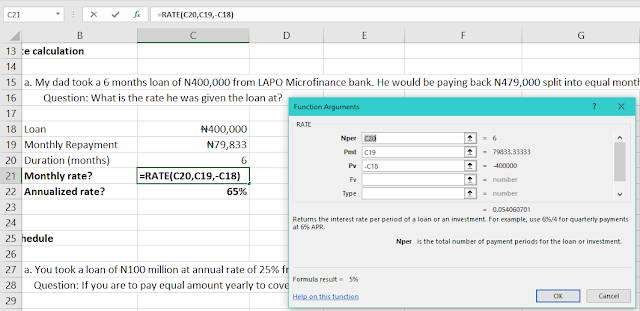
This is useful for those who take microfinance loans or co-operative loans or buy land on installment payment or any loan that you are required to pay specific constant amounts regularly. It would make a lot of sense to calculate what the actual rate of the loan is, since most times they don't provide you the rate.

e. Joe took a 6 months loan of N400,000 from LAPO Microfinance bank. He would be paying back N479,000 split into equal monthly payments.
Question: What is the rate he was given the loan at?


No comment. You go figure out.

NPER
This is useful for calculating how long it would take you to finish paying for a car or home if you opt for an installmental payment amount you choose. 

f. Your company has a car loan scheme. You took N4 million loan to buy a car and you are allowed to make monthly repayment at a 2% monthly rate.
Question: How long will it take you to pay off the car loan if you make a monthly payment of N200,000?


No comment. You go figure out.


Don't forget to watch the demonstration video and work along with the practice file.

Monday, September 4, 2017

Using Fuzzy Lookup In Excel To Match Inconsistently Spelt Items, like People's Names

VLOOKUP won't help you if you need to match two list of names where the first name -- last name positions are often swapped and middle name initial is present in one but absent in the other.

What then can you do?

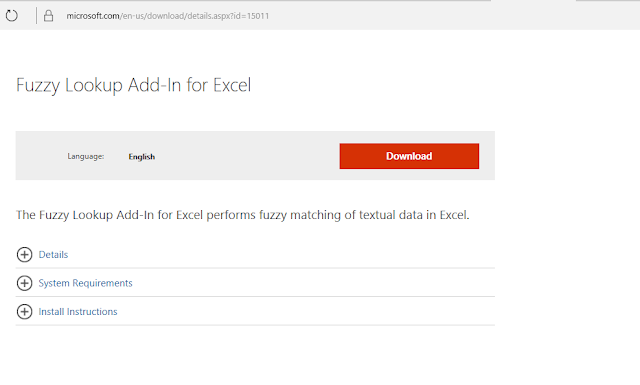
Use Microsoft's Fuzzy Lookup add-in. You can download it here: Microsoft Research's Fuzzy Lookup

When you are done installing it, you will see it show as a new menu tab in your Excel.


If it's not showing up in yours, you might need to toggle it off and on in the COM Add-in section of Excel Options.


So how do you use it?

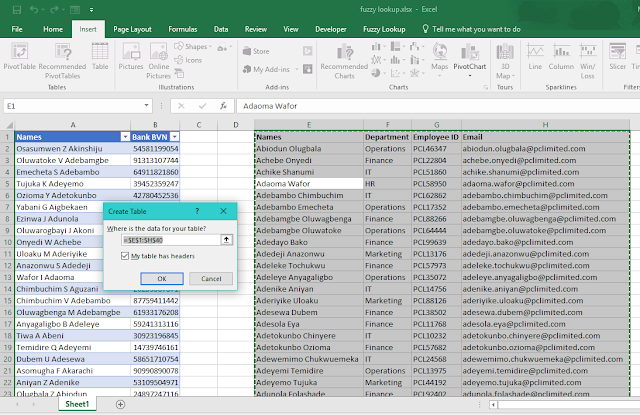
Copy the two records side by side in one sheet in Excel.


 Then format each record set as a Table. And you 60% done. 


Just launch the Fuzzy Lookup tool and set the fields you want to match. Set the Similarity Threshold. 


Select the cell to put the output results and click on Go.


And that's all! You'll see it work its magic, saving hours you would have spent doing manual matching.


Monday, August 28, 2017

Recording of June 2017 Webinar On Useful Add-ins You Should Be Aware Of In Excel

This is a webinar on the add-ins I use a lot.


I work primarily with Excel and do projects for different companies across different industries and different countries/continents. To make my work and life easy I often use some add-ins in Excel.


Some of those add-ins are enhancers, enabling me achieve faster what I could still have done without the add-ins. And some are indispensable, without them I couldn't have gotten the job done.


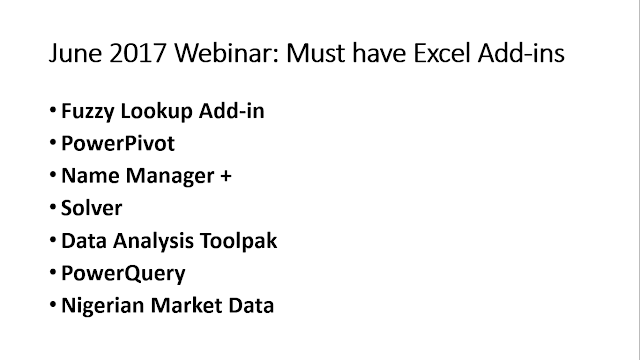
The add-ins are
  1. Fuzzy Lookup Add-in
  2. PowerPivot
  3. Name Manager +
  4. Solver
  5. Data Analysis Toolpak
  6. PowerQuery
  7. Nigerian Market Data
You can watch the recording of the webinar at https://www.youtube.com/watch?v=vbKf76RqIp4

There were some issues at the beginning and somewhere in the middle, you might need to fast forward through those places till I am able to do an edit of the video (hopefully this night).

Enjoy!

Monday, August 21, 2017

Power BI #2: Getting To Know The Power BI Desktop

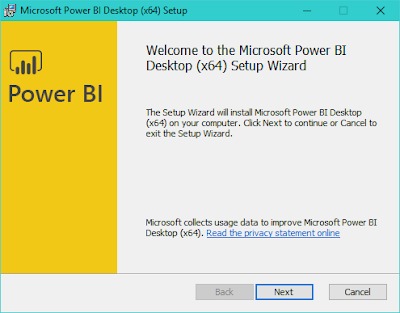
The Power BI Desktop is the main tool you would be using in creating Power BI reports. You can freely download it here from Microsoft


Once you are done installing it. You get a startup screen like the one below.


There are two major parts of Power BI Desktop you will need to get very familiar with:

1. The Designer part.


2. The Query Editor part.


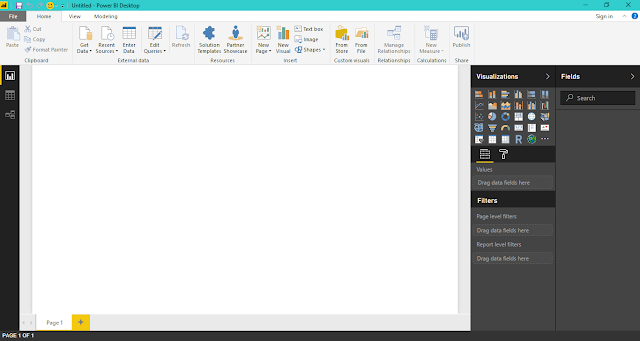
Let's start first with the Designer part. It is the window you are presented with upon launching Power BI. It has four main sections.


  1. The menu section comprising File (for Open, Save, Options/Preference settings etc.), Home, View and Modelling.
  2. The Report, Data and Relationship section
  3. Page section (like Sheets in Excel), and
  4. The context based section that shows Fields and Visualization when you are in Reports, Fields only when you are in Data and nothing when you are in Relationship.
Now to the Query Editor. It is the exact equivalent of PowerQuery (now merged into Get & Transform Data in Excel 2016). Its main function is to help you wrangle data before they are fully loaded/downloaded into the Power BI. So instead of downloading a 16 GB database table and then specifying which fields/rows to keep and which to discard, you can do the specifying using just a preview of the data and only import just the very data you want/need. This is a life and time saver. And space/memory saver too. Then you can do some very interesting and complex stuff you can't do from the Designer part -- like merge or append data from different sources, unpivot and a few other things I find myself doing repeatedly on client/commercial projects.

You get to the Query Editor from the Home menu in the Designer part.


And it has four sections too.

  1. The menu section
  2. The Queries section
  3. The Data section, and
  4. The Query Settings section (which only shows up when you have/selected a Query)
And that is it for this second tutorial post in the new beginner to expert series I am doing on Power BI. Cheers!