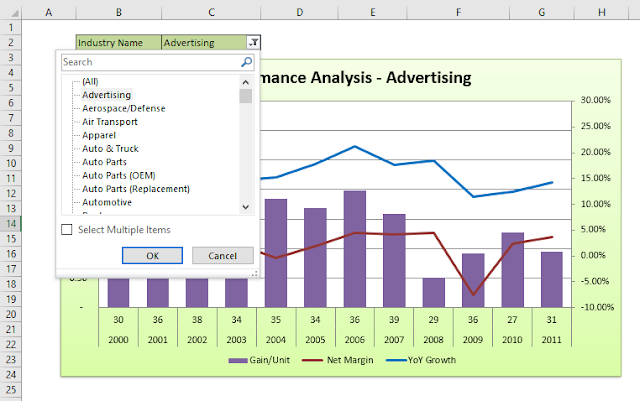
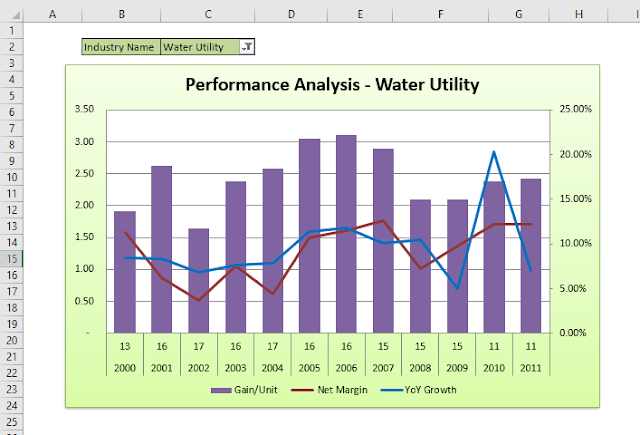
Dashboards are clear visuals of the insights in your reports in a consolidated and easy to understand way. Just think about your car's dashboard. In one glance you get to see the state of your car. And that is the way your visuals should be like if you are making reports on a system as complex as a car, having many intricate moving parts and lots of KPIs to track.
Maybe you are a sales analyst and you track over a dozen brands/products across dozens of regions/areas. Your final report is a labyrinth, even you sometimes get lost in it.
Maybe you make a fairly simple report but the lines of records are many and regular charts look so crowded/clumsy that you have given up including charts in the report.
Or maybe you want to make more engaging visuals, put in some element of interactivity. Make the data come alive.
Then you shouldn't miss this webinar.
Date: Wednesday 26 October 2016
Time: 4:00pm UTC+1
Venue: https://www.youtube.com/watch?v=MfnSWzwU5JY (YouTube live)
We run webinars monthly on how to improve your business data analysis skills. To be among the first informed monthly about the webinars and get timely reminders, please sign up here: Webinar Directory.


