Wednesday, May 22, 2019

Power BI DAX #5: SUMMARIZE

I once facilitated a Power BI training where the participants needed to generate a new table from the sales transaction data (that comes from the ERP) in such a way that they would see all the sales regions, products, Year-Month and total sales quantity.

They already have a table of targets by products for each region. 

Ordinarily, we could have just created a relationship between the transactions data and the target table and leveraged that with measures to create whatever type of report needed. But as it was a training and they needed to experience all the different ways of doing a particular task, we decided to create a table that will extract all the regions, products by regions and total sales volume present in the sales transaction data.

To achieve that, we used the DAX formula: SUMMARIZE

So here's what the sample data I am going to use look like:


And the new table Formula I'll enter is:

Branch_Product_Sales = SUMMARIZE(
'Pizza Sales Data',
'Pizza Sales Data'[Branch],
'Pizza Sales Data'[Pizza Sold],
"Total Sales Quantity",sum('Pizza Sales Data'[Quantity])
)


You can read up on the official documentation of SUMMARIZE: https://docs.microsoft.com/en-us/dax/summarize-function-dax 

In essence, how the syntax works is you put in the table name, the columns you want to pick unique items from (combines across the columns, though, which makes it show all the different products for the different branches repeating branches as many times as necessary to show products in that branch) and you add the aggregation formula to run on a column with the values to do a computation on (indicating the name to give the generated column).

There's a more complex use of SUMMARIZE that involves using ROLLUP and/or ROLLUPGROUP. You can get a sense of what they do by going through the already given documentation link.

Here's a short video to demonstrate the formula: https://youtu.be/X8mqjSQ9gOo


Enjoy!

And to join our Power BI training class, visit https://www.urbizedge.com/powerbi or call 01-6311885 or email team@urbizedge.com

Wednesday, May 15, 2019

How To Automatically Pull In New Report Data Into Excel Using PowerQuery

One common situation most users of Excel face in making recurrent reports -- daily reports, weekly reports, monthly reports etc -- is that of updating the raw data part of the report with the new data for the period they are creating report for.

As simple as this looks, it is often a boring, repetitive and time consuming task. It could mean having to copy and paste data from the new source data files every day. For some people who get data from different sources (branches, sales people, departments etc), that coping and pasting can easily become a 20 mins task with potentials for human errors.

How do you set up your report to automatically pull in new data from source files? PowerQuery is the answer.

And if you are wondering if this will work for data that you get over emails daily/weekly/monthly. Yes, it works for them too.

The major step is to always save the source files in a dedicated folder. Have a folder on your computer than will hold only those source data files. The files can be Excel files or text files (CSV, TSV etc).


Also, ensure that the files have same table column structure -- same table headers arranged in a consistent manner.

With all these done, you are half way.

In demonstrating this, I have a folder where I put in sales data from different branches of a Pizza restaurant. Everyday, I am required to do sales reports, trend analysis and target/KPI dashboards from all these sales data for management. Before, I would copy paste all the source data in a particular sheet on my daily report template. This could take between 5 to 15 mins depending on how tired/refreshed I was and if any interruption that makes me forget where I stopped.


Now with PowerQuery, all those boring aspect of the reports are fully automated away.

Instead of copying and pasting the content of the different source files into Excel, I go to Data menu, Get & Transform, Get Data, From File and From Folder.


Browse to the folder destination and select it.


You'll see all the files in the folder. Select Combine and Load, in the Combine options.


Pick the sheet that's got the data. That sheet name must be consistent across all the source data files.


Wait a couple of seconds while PowerQuery does its magic.

Notice how all the branches data have been pulled in.


And that's not the best part. The whole essence of my proposing PowerQuery is to handle tomorrow's source data and the days after.

So how does it work?

Very easy.

Just replaced the data files in the folder with tomorrow's data files. Then right click anywhere in the combined table data and select Refresh.

What if there's a new branch that just sent me their data after I had done all of these, what should I do to bring in that new branch's data? 

Again, very easy.

Include/save the new branch's data file in the dedicated folder. And click on Refresh in the combined table.

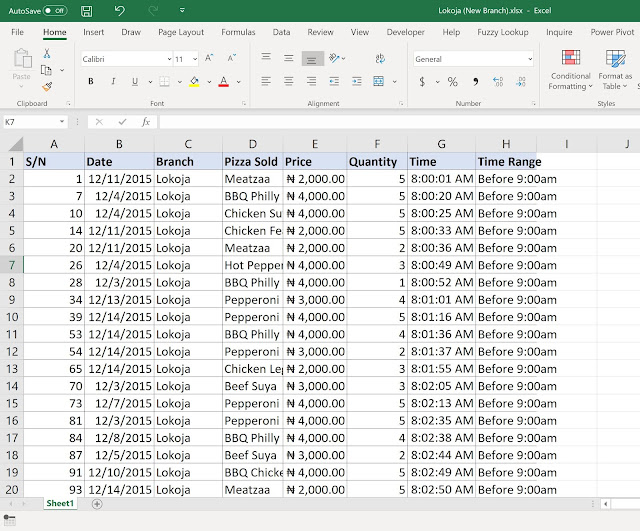
See an example below. 


We launched a new branch in Lokoja and after creating my report for the day, I suddenly got an email of the sales data for that branch and asked to include it in the daily report.

I simply add the branch data file to the dedicated folder and click on Refresh in my already existing combined table.


And that's all!

No more zombie-like copying and pasting.

You can watch the short video demonstration: https://youtu.be/mKEHb0OWuP8


Enjoy!

For all your Excel training needs, you can check us out at https://www.urbizedge.com/Excel or call 01-6311885 or email team@urbizedge.com


Wednesday, May 8, 2019

Power BI DAX #4: CALENDAR, every sales/operations analyst friend

If there exists a book of ten commandments for Power BI, one of the commandments will be -- always have a date table.

A date table is a table that has just dates, and maybe any derivative of a date (month, quarter, year etc.)

Why do you need a date table?

Two easy/quick reasons:

  1. You have many tables with date columns in each. It is better to have one table to include all the date periods you need and be related to all these other tables.
  2. Even if you have just one table, as long as that table can have date gaps or 1900 for some records or 2090 for some records; you'll want to have your own better controlled date table rather than battle endlessly with wrong date entries in source data table. This is common when old data are migrated from a legacy tool.
So how do you create a DATE table easily in Power BI?

The answer is CALENDAR.

If I know how far back I want to go, then I would just specify that date as the start date and today as the end date.

Some other times, I would let CALENDAR use FIRSTDATE to get start date and LASTDATE to get end date.

Other times, I would specify a specific date and specify a specific end date (not TODAY, could be a future date).

For this illustration, I would use a specific start date and TODAY as the end date. Power BI will always increment the dates everyday -- that is the magic of putting TODAY as end date.


Calendar = CALENDAR(DATE(2016,01,01),TODAY())


Notice I used DATE to put in the specific date.


You can watch the YouTube tutorial: https://youtu.be/oodi9Vz0eeQ


Enjoy!

And to join our training class, visit https://www.urbizedge.com/powerbi

Thursday, May 2, 2019

Power BI DAX #3: VALUES, another must know DAX formula

One common situation sales analysts face is capturing newly introduced products or SKUs or Region or Sales Rep in their reports. In Excel, you'll have to do something extra -- and if you are not an Excel ninja, that something extra can be very significant and time costly.

With Power BI, you might not need to do anything extra if you are good with using VALUES.

CASE STUDY
You are the sales analyst for Mega Pizza. Everyday you report sales by branch. But every couple of months, a new branch is opened. On the ERP the sales for each new branch is automatically captured, but on your report you'll have to include this new branch and assign it the general target given to all branches.

How will you achieve this automatically in Power BI without having to do any extra/manual intervention when a new branch is live.

ANSWER: VALUES

First, a screenshot of what the transaction data from the ERP looks like.


We are going to create a new table from this table extracting the unique list of branches from the ERP live data table. And that's exactly what VALUES does. 

VALUES is the DAX formula that extracts a unique list of records from a table or column. You can read more about it from Microsoft Documentation: https://docs.microsoft.com/en-us/dax/values-function-dax

There is also DISTINCT but VALUES allows for referential integrity check which makes it a better choice for most tasks. If you read through the documentation link I gave you'll get a more thorough explanation of what I mean by referential integrity check and practical difference between VALUES and DISTINCT.

And here's how to use VALUES for the scenario I just described.

Branch Targets = VALUES('Pizza Sales Data'[Branch])


And to finally make it meaningful. I add a New Column that assigns the target all branches are given (assuming Mega Pizza doesn't discriminate in its target allocation). :)


You can watch the YouTube tutorial: https://youtu.be/pLZhm0R2KrU


Enjoy!

And to join our training class, visit https://www.urbizedge.com/powerbi