Showing posts with label powerbi. Show all posts

Saturday, December 9, 2017

Power BI #3: The Query Editor

When you launch the Power BI Desktop, the start up screen you get has Get Data on the top left side.


The Get Data is the your first window into the Query Editor. If you are familiar with Excel, the Query Editor is the exact replica of PowerQuery. 


In Power BI, it is your main data manipulation and data cleaning tool. Once you connect to the data you want to analyse, it is good to go to the Query Editor to examine the data and, if the data needs some cleaning or transformation, do all that transformation in the Query Editor.


Clicking on Edit, when done connecting to the data, takes you to the Query Editor, and I recommend you always use Edit rather than Load which brings in the entire data without allowing for preview and modification/transformation.

Below is what the Query Editor looks like and it always opens as a separate window from the main Power BI window.


The Query Editor can be divided into four functional sections.


1. Menu section
2. Queries section
3. Data Preview section, and
4. Query Settings section.

The Menu section is more like the control panel housing all the tools you will need for most of your data cleaning and data transformation processes. In the end, it is a section you will have to be very proficient at and we will do a lot of practical demonstration of real world analysis that involves using this section.

The Queries section mainly lists all the data sources you are connected to. Right-clicking on any of the data source gives you some very useful set of options.


The Data Preview section shows a preview of the data selected in the Queries section. This gives the Query Editor some advantages over loading the data directly into the Data model, especially in a case of a large data set that would take too many system resources and time to load. By loading just a preview, one can get working immediately on the data and even set filters and formulas to pull in just the segment of the data set that is needed rather than pulling in the entire data set. It also has some useful features — like filter, rename, delete, replace errors and others.


The Query Settings serves as a very interactive and feature-rich audit trail. It allows you to see all the transformation steps carried out in applied order. You can modify any step and re-order the steps if you want.


In future chapters we will do some real world analysis that will help us further dive into the Query Editor and see its practical usefulness.

Monday, August 21, 2017

Power BI #2: Getting To Know The Power BI Desktop

The Power BI Desktop is the main tool you would be using in creating Power BI reports. You can freely download it here from Microsoft


Once you are done installing it. You get a startup screen like the one below.


There are two major parts of Power BI Desktop you will need to get very familiar with:

1. The Designer part.


2. The Query Editor part.


Let's start first with the Designer part. It is the window you are presented with upon launching Power BI. It has four main sections.


  1. The menu section comprising File (for Open, Save, Options/Preference settings etc.), Home, View and Modelling.
  2. The Report, Data and Relationship section
  3. Page section (like Sheets in Excel), and
  4. The context based section that shows Fields and Visualization when you are in Reports, Fields only when you are in Data and nothing when you are in Relationship.
Now to the Query Editor. It is the exact equivalent of PowerQuery (now merged into Get & Transform Data in Excel 2016). Its main function is to help you wrangle data before they are fully loaded/downloaded into the Power BI. So instead of downloading a 16 GB database table and then specifying which fields/rows to keep and which to discard, you can do the specifying using just a preview of the data and only import just the very data you want/need. This is a life and time saver. And space/memory saver too. Then you can do some very interesting and complex stuff you can't do from the Designer part -- like merge or append data from different sources, unpivot and a few other things I find myself doing repeatedly on client/commercial projects.

You get to the Query Editor from the Home menu in the Designer part.


And it has four sections too.

  1. The menu section
  2. The Queries section
  3. The Data section, and
  4. The Query Settings section (which only shows up when you have/selected a Query)
And that is it for this second tutorial post in the new beginner to expert series I am doing on Power BI. Cheers!

Saturday, June 10, 2017

Comprehensive Introduction To Power BI And The Value Proposition

Power BI is Microsoft's self-service Business Intelligence solution and is the most popular self-service BI solution in Nigeria. Many companies in Nigeria are beginning to realise the huge importance of having flexible and robust BI reports and a lot of them are turning to Power BI due to the local presence of Microsoft and the low entry fee of Power BI compared to the other self-service BI solutions.

As a business professional, what do you need to know about Power BI and its potential value to your organization? Well, that is what we are going to discuss in the next few paragraphs.

Before the advent of self-service BI solutions, companies used to have a data warehouse or IT team who manage the company-wide data using Microsoft SQL servers, Oracle database servers and MySQL database servers (there are others but these are the most popular ones). These tech-savvy team model the company data and provide portals for the other teams/departments in the company to download data they need for their reports. Sometimes, they create reports too for the business managers to consume but these reports are often static and not robust enough for day-to-day business needs. Hence, the need for a second group of people -- analysts. They could be sales analysts, operations analysts, customer service analysts, marketing analysts or data analysts. This set of people create the highly important day-to-day reports that management use to keep the business running smoothly and for strategic planning. These reports are mostly made with Microsoft Excel because of its ease of use and managers' preference for it. And again, before now, this was good enough.

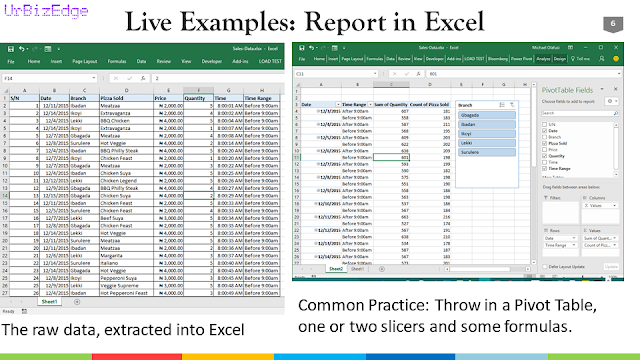
However, since the advent of self-service BI, Excel is now no longer good enough for reporting all the business operations. Excel is still extremely important and useful but not great at providing real-time robust dashboards/reports that can be consumed on the go by managers (without having to lug around a laptop and Excel). Managers are increasingly looking for reporting tools that provide them real-time access to their business data reports and accessible from their iPads, tablets and smartphones even in the middle of the night or while on a vacation in a remote island/village. And that is the very thing with many other valuable features that self-service BI solutions like Power BI provide.

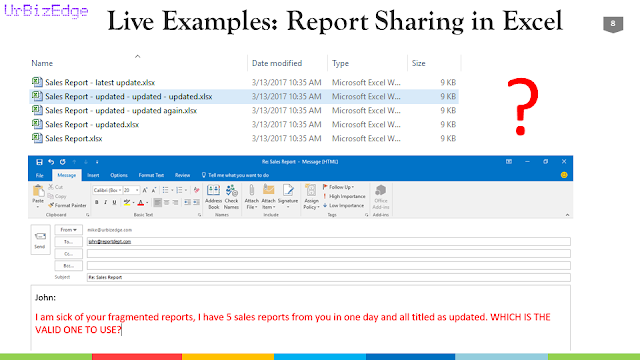
With Excel, you have to create the reports repeatedly and email them out. I used to work as a business analyst and MIS analyst for Comviva on an Airtel Africa CRBT project. I often say I worked for Airtel Africa as Comviva was a sister company to Airtel, both were owned by the Bharti Group. I used to create 11 daily reports -- one for each of the 10 countries we were operating in in Africa and one pan-Africa report to the Airtel HQ in Kenya. Then every Friday, I create a weekly report and presentation. Been very good in Excel, I created a template to automate the reports and reduce my daily repetitive tasks. Yet two things could not be automated away and gave the management concern -- they only get the reports when I email them out and they always have to view it on their laptops. How were these a problem? On Saturday and Sunday, they are blind. They don't see what has happened all throughout the weekend till I send out reports on Monday. Then, whenever they are in a meeting or on a flight, they have to wait till they can open their PC, download the reports and interact with it before they can fully know what's in it.

Now, with Power BI, those problems are no more. I can design the reports once and set it to update automatically each day, so I don't have to daily recreate the reports. Then the managers can view the reports any day, especially on Saturday and Sunday, and see the updated (real-time) analysis. Lastly, they don't have to be on their PC. They can access the reports on their smartphones, tablets and any internet connect device that has a good browser.

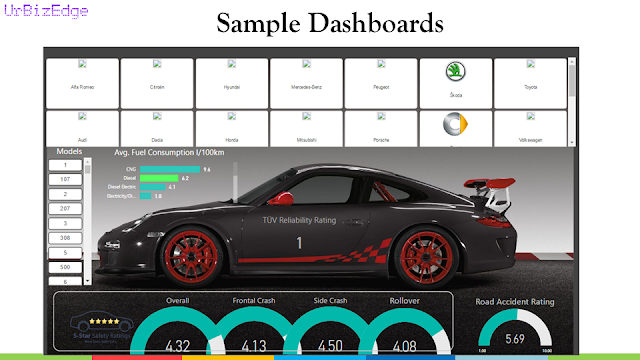
And those aren't just the benefits. You get drill-down capabilities, enhanced visualizations, KPI trigger alerts and many more benefits that managers won't want to turn a blind eye to. Below is the extract of the slides I use to present the benefits of Power BI to managers. You can also view one of my openly available Power BI dashboards that I often use to show the power of Power BI: here and here. Enjoy! 

Note: the sample dashboard slides are extract from publicly available dashboards on Power BI Data Stories Gallery and the quote + architecture slides are from Brandon George's presentation.


Thursday, November 3, 2016

Training: Data Analysis and Business Intelligence Using Power BI

Data is the new crude oil. And business success in the 21st century is heavily reliant on the ability to mine and use relevant data about consumers, internal operations, financial operation and industry trend to drive business decisions.


UrBizEdge Limited, Nigeria’s leading business data analysis company is putting together this special training for proactive business professionals who already have some experience with business reporting and quantitative data analysis.
We will be focusing on Business Intelligence and how to create BI reports that leverage participant’s current data analysis skills using Microsoft’s Power BI. Power BI enables organizations to have a wholesome understanding of what is happening at all operational levels of the company.
This training is coming up on Friday 2nd December 2016 to Saturday 3rd December 2016. It covers our industry recognized certificate, practice materials, required software, tea break + lunch and other training materials.

The training will be facilitated by an officially awarded Microsoft Most Valuable Professional (MVP). And we have had participants of our training from Promasidor, Citi Bank, Dalberg, SaveTheChildren, Mobil, Total, Vodacom, Nestle, Guinness Nigeria, Nigerian Breweries, Delta Afrik, LATC Marine, Broll, Habanera (JTI), SABMiller, IBM, Airtel, Diamond Bank, ECOWAS, Ministry of Finance, Palladium Group, Nokia Siemens Networks and DDB.

To register reach Michael on 08089382423 and mike@urbizedge.com or Hannah on 08021180874 and hannah@urbizedge.com to register. There is a class size limit.
Date: Friday 2nd December 2016 to Saturday 3rd December 2016
Time: 9:00am – 5:00pm each day
Venue: Kristina Jade Learning Center, 70b Olorunlogbon street, Off Alade Lawal street, Anthony Village, Lagos. 
Cost: N100,000/participant

The training will cover: 
1.       Power BI’s strength and weakness compared to the other popular BI tools
2.       Important concepts of Power BI
3.       Connecting to any type of data source (from structured to unstructured which will require some transforming)
4.       Getting data from existing services, organizational content pack, flat files and live databases
5.       Data Transformation (very broad and requires some knowledge of data analysis) and we will use DAX formulas too
6.       Creating relationships between the datasets and leveraging hierarchy (a.k.a. data modelling)
7.       Creating Reports
8.       Visualizations and the science behind choosing the right visuals
9.       Importing custom visuals (especially word cloud for sentiment analysis and other very useful non-native visuals)
10.   Creating dashboards
11.   Publishing Reports from the Power BI Desktop and pinning to dashboards
12.   Scheduling refresh
13.   Q & A Natural Language query
14.   Integrating with Cortana
15.   Live Dashboards
16.   Collaboration and sharing
17.   Printing the dashboard
18.   Analyzing the dashboard data (report) from Power BI service in Excel (new feature)
19.   Value Proposition to corporate customers
20.   Use case scenarios for entire company or business unit or departments
21.   Access from mobile app and setting data alerts (automated notifications when something of note happens)
22.   Lots of interaction (Q&A) and practice

 
Reach Michael on 08089382423 and mike@urbizedge.com or Hannah on 08021180874 and hannah@urbizedge.com to register. There is a class size limit.


You can also sign up for our highly educative tutorial newsletters at http://blog.urbizedge.com/ and read/download our Data Analysis Industry Report for 2016 for your company use.

Tuesday, July 5, 2016

How To Add Additional Charts (Custom Visuals) To Power BI

Yesterday was demo day for me. I did a demo of Power BI for a client for another client. It was the third time I am officially demo-ing Power BI to a large company, and increasingly companies are beginning to give Power BI serious considerations.


In today's post I will be focusing on custom visuals for Power BI -- new chart types you can add to Power BI.

Power BI comes with 27 visualizations (charts), you can easily increase them to over 70 by installing custom visuals, like I have done.


And they are very easy to install. Just head to https://app.powerbi.com/visuals/ and download the ones you like (I recommended at least the Word Count visual).


Next is to import to Power BI Desktop.


And that's it! Now you can add as many custom visuals as you want and create very beautiful dashboards to stay on top of your business data.