
Here is the R code text.
# Load in necessary libraries
require(ggplot2)
require(lubridate)
nse_asi<- csv="" data_analysis="" font="" read.csv="">
nse_asi$Date<- ate="" font="" mdy="" nse_asi="">
# Uncomment the following lines to see the structure and preview of the raw data
#str(nse_asi)
#summary(nse_asi)
#head(nse_asi)
# This next lines of code are to generate the charts for each company in a separate window
# It is not compulsory, and might be worth commenting out if it makes your computer freeze
for (cmpy in unique(nse_asi$Company)){
dev.new()
print(ggplot(data=nse_asi[nse_asi$Company==cmpy,], aes(x=Date, y=Last_Price))+
geom_line() +
ggtitle(cmpy) +
labs(x="Date",y="Price") )
}
# This is the most important chart code. Generates the charts in a neatly grouped way
ggplot(data=nse_asi, aes(x=Date, y=Last_Price, group=Ticker, color=Ticker))+
geom_line() +
facet_wrap(~Ticker,scales="free") +
labs(x="Date",y="Price") +
theme(legend.position="none")
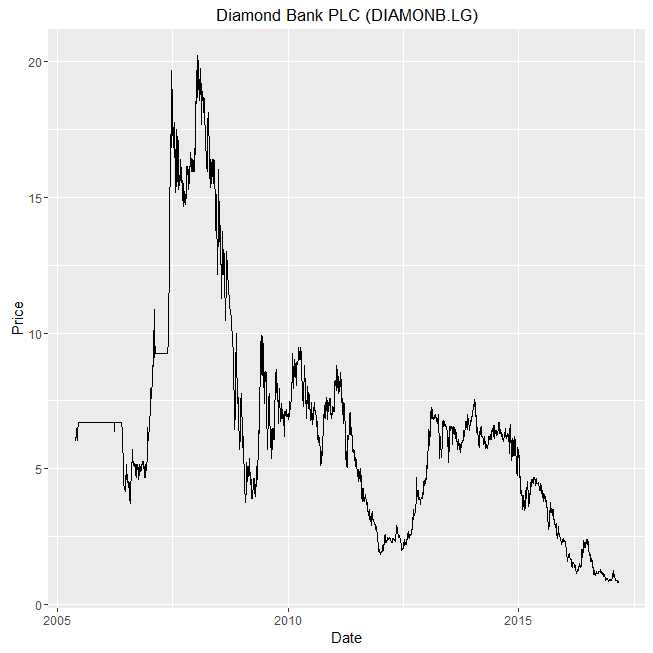
And below are the results. Enjoy. Lots of screenshots. And make sure you notice the interesting insights: like how investors in Presco, Okomu Oil, United Capitals and Mobil would have been smiling to the bank despite the market depression and economic recession. I personally made some gain from Mobil. Also notice how not very long ago, 1 USD exchanged for 22 Naira.
 |
| NSE ASI (pointed out with the red line) and 48 top stocks |
 |
| FGN 10 Year Bond Yield |
 |
| Nigeria Real GDP Growth from 1960 till Today |
 |
| US Dollar to Nigerian Naira Exchange rate |


Since the complete workflow is implemented using R with packages such as ggplot2 and lubridate, this article also serves as an excellent reference for R Programming Projects. R remains one of the most powerful environments for statistical computing, financial analysis, and creating high-quality visualizations from complex datasets.
ReplyDeleteThe analysis of stock prices, exchange rates, GDP growth, and bond yields highlights the importance of forecasting and trend analysis in financial markets. Students interested in developing predictive models for stock market trends, currency movements, and economic indicators can explore Time Series Projects, where historical data is leveraged to build accurate forecasting and sequential analysis systems.
ReplyDelete