Today, I'll show you a demonstration of how to use Power BI. First you'll need to sign up, download and install the Power BI designer. Just head over to www.powerbi.com
You'll get an email with the download link of the Power BI designer. Download and install it. Then launch it.
Once it's done loading, click on Get Data. I am going to demonstrate using it with Google Analytics to monitor your blog or website performance.
You'll get a list of data sources you can connect to. If you scroll down you'll see Google Analytics and even Facebook. But for this demonstration, it's Google Analytics we'll use.
Then you'll have to supply your Google Analytics account login details to authorize Power BI to connect to your Google Analytics account. I have already done that and forgot to take a snapshot; now that I want to take a snapshot I am unable to redo it. But if your login and authorization is successful you will see a list of all the websites you track on Google Analytics.
I have my Google Analytics account connected to five websites, but for this demonstration I pick my blog -- olafusimichael.com
I add the metrics I want to track: Pageviews, Sessions, Country, Bounce rate, Date, Keywords, Source and a few other metrics. Then I load them into Power BI.
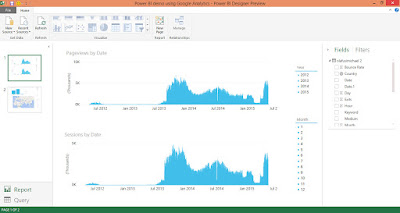
I click on Report in the lower left corner to begin creating my visual analysis. I drag the metrics I want to visualize into the report page and set the type of visualization (chart, map, table or slicer). Below is what I created.
I then save the design.
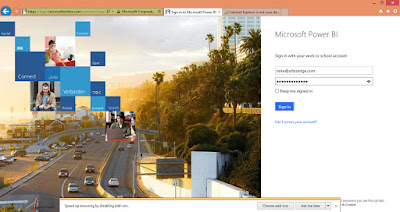
Again, I go to www.powerbi.com but to sign in. I need to upload my design so I can have access to it on my PC, smartphone, tablets and any internet connected device.
I log in with the email and password I created when I signed up. And I am taken to the online dashboard where I will upload the report I created with the Power BI designer by clicking Get Data at the lower left corner.
Once I am done uploading. I will see the report I created.
And I can put some of the metrics in a summary dashboard by pinning them.
This is what my Dashboard looks like after pinning the metrics I am most interested in.
Finally, you can set the frequency of updates/refresh the dashboard should make to the underlying dataset (Google Analytics in this case).
Now you have a dashboard that is updated automatically daily and can be accessed from any PC, smartphone or tablet. It can also be shared.
Go ahead and install Power BI on your smartphone (I think only iPhone and Windows phone for now). Sign in with your account and you see your dashboard.
If you tap on a metric, you can set an alert point. Maybe you want to be alerted when a particular metric reaches a specific value. In this example, I might want to be alerted on any day my pageviews exceed 10,000.
And that's a quick demonstration of how to use Microsoft Power BI. Don't forget to sign up for our webinar coming up this Thursday, Sign Up for The Webinar


No comments:
Post a Comment