Tuesday, April 25, 2017

Analyzing Nigeria Stock Market, Bond Yield, Exchange Rate and GDP Using R

Today I decided to do an interesting analysis using R. I compiled actual/live data from as far as 1998 on Nigerian All Share Index and 48 of the most valuable stocks. You can access the raw data here: https://drive.google.com/open?id=0B4XKk-Dstn-eVjRMQ0hQR0hvQ3c

Here is the R code text.


# Load in necessary libraries
require(ggplot2)
require(lubridate)

nse_asi<- csv="" data_analysis="" font="" read.csv="">
nse_asi$Date<- ate="" font="" mdy="" nse_asi="">

# Uncomment the following lines to see the structure and preview of the raw data
#str(nse_asi)
#summary(nse_asi)
#head(nse_asi)


# This next lines of code are to generate the charts for each company in a separate window
# It is not compulsory, and might be worth commenting out if it makes your computer freeze
for (cmpy in unique(nse_asi$Company)){
  dev.new()
  print(ggplot(data=nse_asi[nse_asi$Company==cmpy,], aes(x=Date, y=Last_Price))+
  geom_line() +
  ggtitle(cmpy) +
  labs(x="Date",y="Price") )
}

# This is the most important chart code. Generates the charts in a neatly grouped way
ggplot(data=nse_asi, aes(x=Date, y=Last_Price, group=Ticker, color=Ticker))+
  geom_line() +
  facet_wrap(~Ticker,scales="free") +
  labs(x="Date",y="Price") +
  theme(legend.position="none")


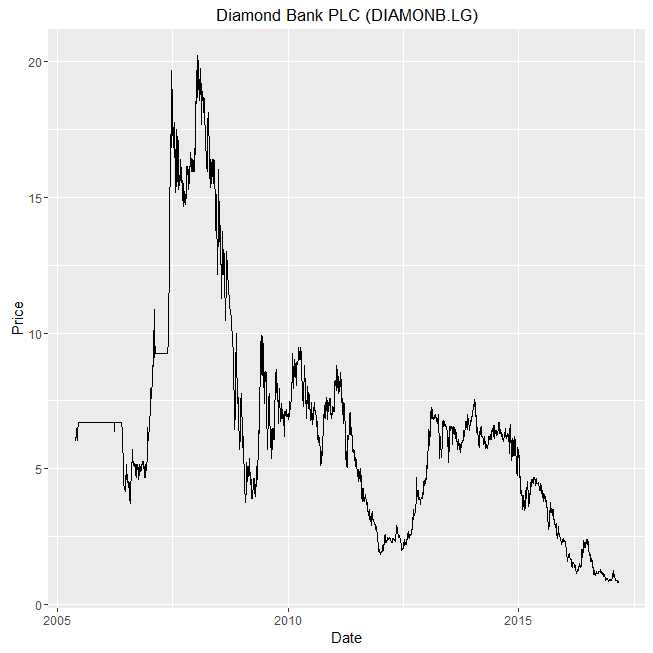
And below are the results. Enjoy. Lots of screenshots. And make sure you notice the interesting insights: like how investors in Presco, Okomu Oil, United Capitals and Mobil would have been smiling to the bank despite the market depression and economic recession. I personally made some gain from Mobil. Also notice how not very long ago, 1 USD exchanged for 22 Naira.

NSE ASI (pointed out with the red line) and 48 top stocks

FGN 10 Year Bond Yield

Nigeria Real GDP Growth from 1960 till Today

US Dollar to Nigerian Naira Exchange rate


Tuesday, April 18, 2017

Webinar: Excel vs Python vs R for Data Analysis. Making the right pick.


There is a lot of textbook arguments on Excel vs Python vs R. In fact, a few weeks back I used to be part of that argument. I took sides with Excel. And I had my solid reasons.

But now I don't take sides anymore. I focus on a bigger picture, a picture I became aware of only after I transitioned for reading textbooks and doing video tutorials on Python and R to carrying out live interesting projects with them.

In this webinar I will be sharing my experience on using them all and what practical insight you too need to have to move from those textbook arguments to seeing the big picture. And most importantly, I will be showing you that big picture.

You shouldn't miss this webinar.

Time: 3:00pm to 4:00pm
Date: Tuesday, 21 March 2017
Venue: YouTube Live

You should set it up in your calendar with reminders so you won't miss this special edition.

See you!

Note: The webinar already took place but you can view the YouTube recorded session at https://www.youtube.com/watch?v=YLoOynh8iNQ 

Tuesday, April 11, 2017

Real-time Interactive Nigerian Stocks Analysis Portal

You asked and I have delivered. And I want to say a big thanks to everyone who kept asking and nudging me do to this -- I am happy to say its done.

Everyday, it automatically updates with the close of trading day price (for now set to 12 midnight, will adjust to late afternoon). It also shows the historical price from as far back as year 2002. That is something you won't get on any other platform for free. And the best part is that it is very interactive, I built it more like I do dashboards for very high paying clients.

It also allows you to compare the important financial statement lines of the stocks you are interested in: from Revenue, Net Profit, Return on Equity, Return on Assets, Total Assets, Gross Margin, Cashflow from Operations, Cashflow from Financing, Cashflow from Investing, Net Cash Flow, Current Assets, Current Liabilities to Total Liabilities.
And all very visual.
It has a scroll bar that shows you the latest closing price of all the stocks.
At the backend, I have a program that populates an Azure SQL database table with the closing prices for the stocks. I already have a stockpile of the annual reports of the companies from as far back as 2001 (you can check them out and download for free at https://www.slideshare.net/olafusimichael/presentations). Each year, I update the financial statement metrics from the Income Statement, Balance Sheet and Cash Flow.

Important Notice

Due to the hard work involved, I only cover the most active stocks on the Nigerian Stock Exchange. If there is any you would like to see that isn't there, do let me know and I may include it. Also there is an error in the Total Assets and Total Equities line for a couple of the bank stocks, I am working on making the correction. Other than that, all is working great (hopefully) and I use it for my own stock analysis. And that is the big edge, it is like I am sharing my quantitative stock analysis model with you all for free and in a very beautiful (to see and use) dashboard.
There are no 2016 financial metrics in yet. I am still gathering all the 2016 annual reports. Some companies have made theirs available online in the last two weeks, some are yet to. Maybe I won't wait till I have them all before I start the financial metrics extraction. I have already gotten for GTBank, First Bank, Total Nigeria, Access Bank, Dangote Cement, Cadbury, PZ and a few other companies.
The whole set-up (programming, hosting, virtual machine, SQL server etc) costs me money and I often pay freelance finance analysts to help share the work of extracting the data from the PDF annual reports into our standardized model. One day, I will put a door that opens only to paid subscription in front of it. So enjoy while its free!

Tuesday, April 4, 2017

Introduction to R and Python

R is, arguably, the world's most popular programming language for data analysis. It is an adaptation of S language developed by Bells Laboratories strictly for statistics and data analysis. S language became very popular and R grew out of it as the open-source implementation of S language in August 1993.

The popularity of R is due to its open-source nature and the huge community contributing packages to it that handle all types of common data analysis work. You can read more about R at http://www.r-project.org/ and a more detailed history of R at http://www.r-project.org/about.html

Python, on the other hand, is a general purpose programming language. It is used for all types of programming from building websites (web applications) to computer programs and data analysis. It was created by Guido van Rossum in 1991. It is also an open-source language, benefiting hugely from a large community actively contributing to it. You can read more about Python at https://www.python.org/about/ 

image: medium.com

R and Python are the two most popular languages for data analysis. And anyone serious in becoming a data scientist must be proficient in at least one of the two. I recommend that you have average knowledge in both and then become an expert in one.

Both languages have libraries. More often called packages in R. They are already built algorithms that help you achieve specific tasks. More like Excel formulas, though way more robust in nature. You load them into your R or Python work space and can access the functions they provide.

A common need you will encounter is creating graphs/charts. In R, the most commonly used package for that is ggplot2 and in Python you would use Matplotlib.

To start using R and Python, you will need to install them. 

For R, you can download R at https://cran.r-project.org/ and it is recommended to install RStudio to make using R enjoyable. RStudio is an IDE (integrated development environment) and can be installed at https://www.rstudio.com/  With those two installations, you are set to begin analysing data with R. And they work whether you have a Windows PC, or Mac or Linux.

For Python, it is recommended that you download Anaconda at https://www.continuum.io/downloads. It is regarded as the best distribution of Python for data analysis work. And as for an IDE to use, there is no obvious best as RStudio is for R. Some people are a die-hard fan of Jupyter Notebook (formerly IPython Notebook), luckily it comes pre-installed with Anaconda. Others love Spyder (again, comes pre-installed with Anaconda). And there is PyCharm, you will have to install that at https://www.jetbrains.com/pycharm/. For this training series, I will be using Rodeo downloadable at https://www.yhat.com/products/rodeo, it is an RStudio lookalike. That way you won't have to stress yourself too much in getting used to the IDEs. Once you become familiar with RStudio, you will become more comfortable with Rodeo and vice-versa.

In the next sections we will dig deeper into carrying out simple data analysis tasks in both R and Python.